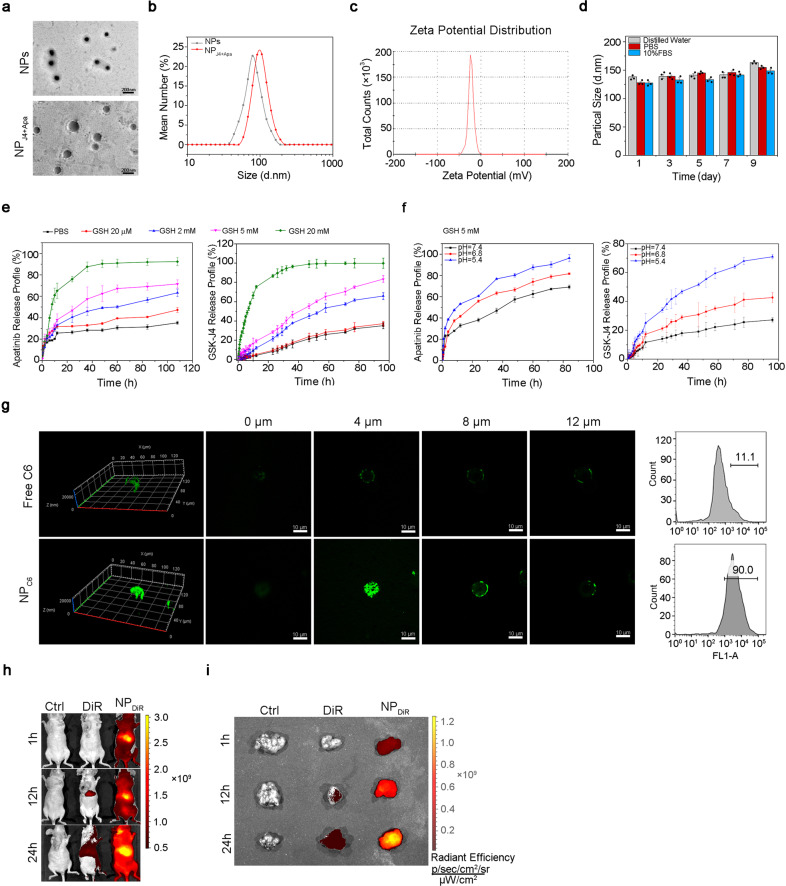
Fig. 5.
Characterization of NPs and NPJ4+Apa. a TEM of GSH-sensitive NPs (upper) and NP loading with J4 and Apa (NPJ4+Apa, lower). The scale length of the TEM image is 200 nm. b DLS micrographs of NPs and NPJ4+Apa. c Zeta potential of NPJ4+Apa dispersed in DI water. d Particle size of NPJ4+Apa in DI water, PBS, or 10% serum in DMEM solutions measured using DLS. e In vitro Apa (left) and J4 (right) release from NPJ4+Apa in PBS at different concentrations of GSH. f In vitro Apa (left) and J4 (right) release from NPJ4+Apa in PBS at different pH. g Penetration of coumarin-6-loaded NPs (NPC6) in the SJSA-1 and 143B-derived OS spheroids. The spheroids were incubated with free C6 or NPC6 for 30 min (green, C6). Flow cytometric quantification of C6 fluorescence intensity after treatment. The scale length of each image is 25 μm. h Representative in vivo fluorescence images of mice taken at three different time points (0, 12, and 24 h) after intravenous injection of saline (Ctrl), free DiR, or NPDiR. i The ex vivo fluorescence image of isolated tumors at 24 h post-injection

