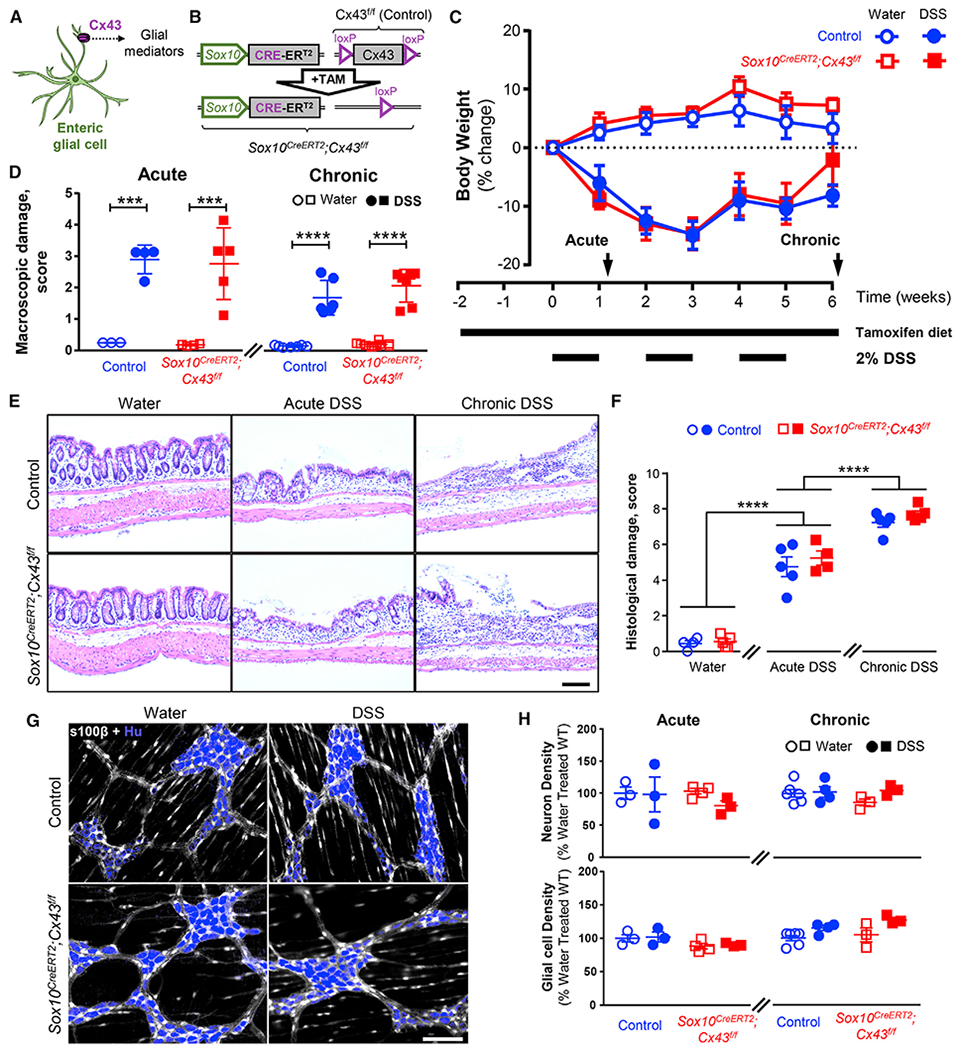
Figure 1. Connexin-43 Deletion in Enteric Glia Does Not Affect the Overall Severity of Acute or Chronic Colitis.

(A) Schematic depicting that Cx43 hemichannels regulate the release of glial mediators.
(B) Schematic depicting the tamoxifen-induced deletion of the Cx43 encoding gene in Sox10CreERT2;Cx43f/f mice.
(C) Quantification of body weight as a measure of colitis severity in control and Sox10CreERT2;Cx43f/f mice. Tamoxifen citrate was administered via diet beginning 2 weeks before the induction of inflammation and throughout the experiment (long horizontal line). Colonic inflammation was induced by 2% dextran sodium sulfate (DSS) in drinking water for 1 week (acute) or intermittently (1 week on/1 off) for 3 rounds (chronic) (short horizontal lines). Experiments were performed at two time points, 3 days after the first course of DSS and a week after the final DSS treatment, to assess the effects of acute and chronic inflammation (arrows). Data are shown as mean ± SEM, n = 5–8 mice.
(D) Macroscopic tissue damage scores at the acute (left) and chronic (right) time points were comparable between the Sox10CreERT2;Cx43f/f and their control littermates. ***p < 0.001; ****p < 0.0001; 2-way ANOVA. Data are shown as mean ± SEM, n = 5–8 mice.
(E) Representative images of hematoxylin-and-eosin-stained colon cross-sections of control (top) and Sox10CreERT2;Cx43f/f mice (bottom) treated with water (left), acute DSS (middle), and chronic DSS (right). Scale bar, 100 μm.
(F) Blinded evaluation of histological staining. See Table S2 for details about histological disease activity scoring. ****p < 0.0001; 2-way ANOVA. Data are shown as mean ± SEM, n = 3–10 mice.
(G and H) The density of myenteric neurons and glial cells is comparable between Sox10CreERT2;Cx43f/f and control mice treated with water or mild acute and chronic DSS models. (G) Representative images of immunolabeling for myenteric neurons (HuC/D, blue) and glia (s100β, gray). Scale bar, 100 μm. (H) Neuronal (top) and glial (bottom) density (cells per ganglionic area) in acute (left) or chronic (right) DSS mice. Hu labeling was used to assess neuron numbers, and s100β was used to identify glial cells and determine the ganglionic area. Data are shown as mean ± SEM, n = 3–6 mice.
