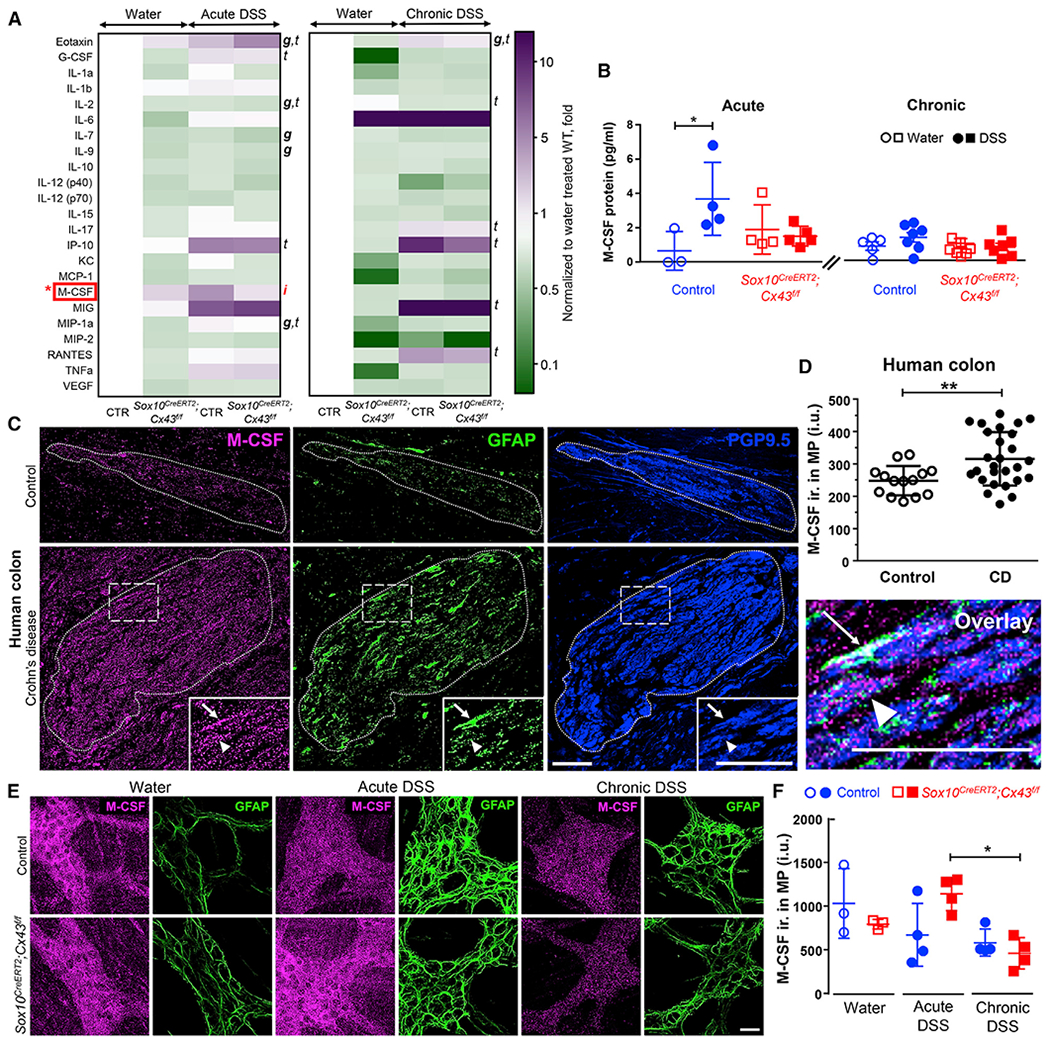
Figure 3. Glial Cx43 Regulates M-CSF Expression during Intestinal Inflammation.

(A and B) Quantification of local cytokine and chemokine production within the mouse colon by a 31-Plex Mouse Cytokine/Chemokine Array. (A) Heatmap showing average relative protein expression after acute (left) or chronic (right) inflammation. (B) Summary data from multiplex arrays showing quantification of M-CSF. Glial Cx43 signaling regulates M-CSF expression during acute colitis. g, genotype; t, treatment; i, interaction; 2-way ANOVA (p < 0.05). *p < 0.05; 2-way ANOVA. Data are shown as mean ± SD, n = 3–7 mice. Granulocyte-colony stimulating factor (G-CSF) was also significantly increased in the sera of DSS-treated animals but was not regulated by glial Cx43 (Figure S1). Transcriptomics data show that mouse enteric glia express M-CSF (Figure S2).
(C) Representative images showing immunolabeling for M-CSF in human myenteric ganglia in colon samples from individuals with Crohn disease and control colon samples from patients that underwent resections for bowel trauma, volvulus, or intestinal bleeding. Dotted lines demarcate the borders of myenteric ganglia, which was defined by PGP9.5 labeling (neurons, blue). Arrows and arrowheads point to glia (GFAP immunolabeling, green) and neurons, respectively. Note that GFAP labeling is increased in Crohn disease samples indicating reactive gliosis. Scale bar, 50 μm.
(D) Quantification of M-CSF labeling in myenteric ganglia from controls without abdominal pain and individuals with Crohn (CD) causing low to high levels of abdominal pain. **p = 0.0016; unpaired Student’s t test with Welch’s correction. Data are shown as mean ± SD, n = 14 and 27 ganglia from 4 and 5 subjects (2 males and 2 or 3 females in each group).
(E and F) Immunolabeling for M-CSF in Sox10CreERT2;Cx43f/f mice and control littermates treated with water, acute DSS, or chronic DSS. Representative images(E) and quantification (F) of M-CSF immunoreactivity (ir., magenta) within the MP, expressed in intensity units (IUs). GFAP (glia, green) was used to identify myentericganglia. Scale bar, 25 μm. *p = 0.0144; 2-way ANOVA, Tukey’s post hoc test. Data are shown as mean ± SD, n = 3–4 mice. Controls for the specificity of the M-CSF antibody were performed in both mouse and human tissues (Figure S3).
