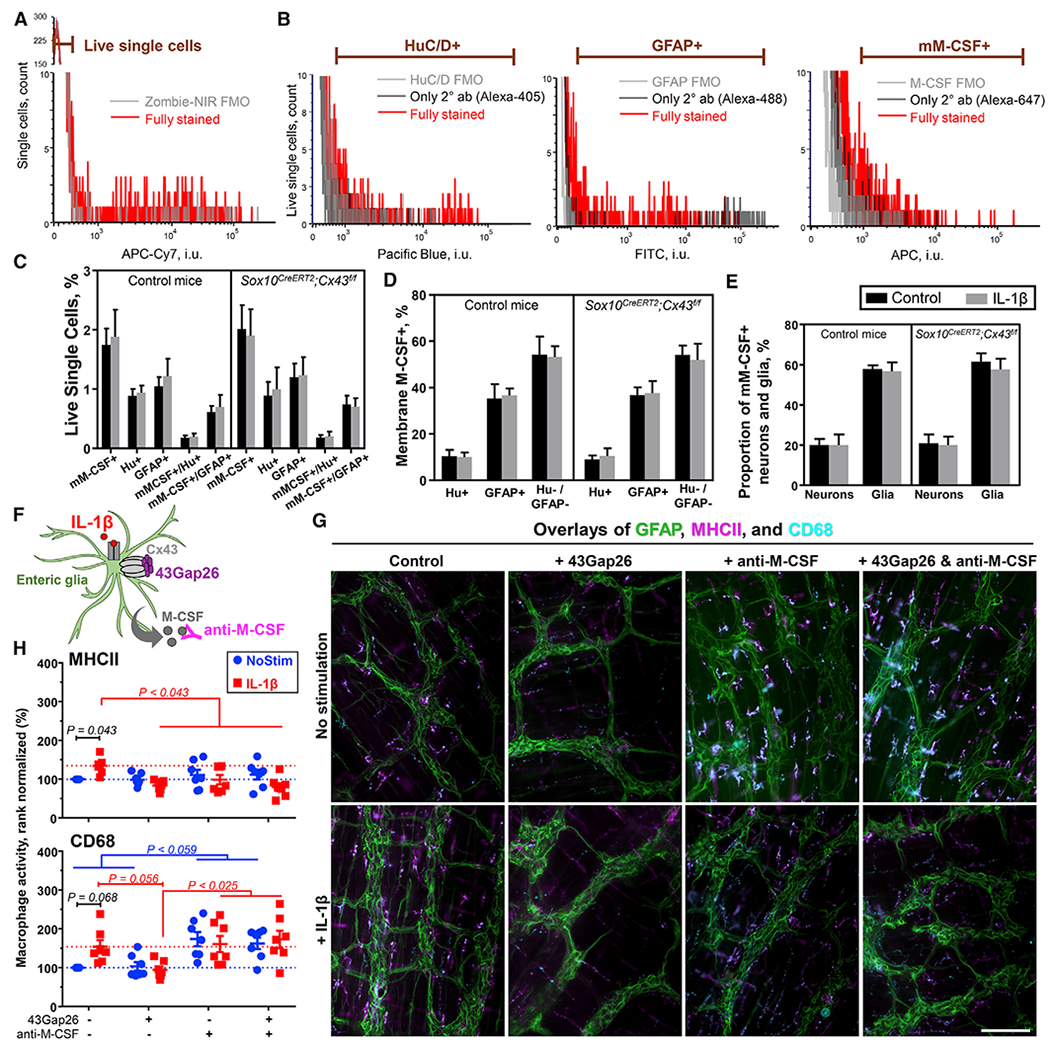
Figure 5. Enteric Glia Are the Primary Source of M-CSF in the Myenteric Plexus and Regulate Muscularis Macrophage Activation through Cx43-Dependent M-CSF Release.

(A–D) Flow cytometry on cells dissociated from the muscular layer of colons harvested from healthy Sox10CreERT2;Cx43f/f mice and their respective controls. Half of each preparation was stimulated overnight with IL-1β (10 ng/mL). (A) The gating strategy for live cells was set using fluorescence minus one (FMO) control. This gate was applied to single-cell events (Figure S5A). (B) Gating strategies for neuronal marker HuC/D (Hu+), glial marker GFAP (GFAP+), and membrane M-CSF (mM-CSF+) were adjusted according to their respective FMO and secondary antibody (2° ab)-only controls. Figures S5B–S5D has dot plots of a fully stained sample and the controls. (C) Proportions of single live cells that are mM-CSF+, Hu+, or GFAP+ or co-express mM-CSF with HuC/D or GFAP. (D) Proportions of mM-CSF+ cells that co-express HuC/D (≈10%), GFAP (≈40%) or no neuron nor glial markers (≈50%).
(E) Quantification of the proportions of enteric neurons (Hu+) and enteric glia (GFAP+) that express mM-CSF (20 and 60%, respectively). Deleting glial Cx43 or treating cells with IL-1β did not affect the proportions of cells expressing M-CSF. Data are shown as mean ± SD, n = 3 control and 5 Sox10CreERT2;Cx43f/f mice.
(F–H) Effects of IL-1β (10 ng/mL), 43Gap26 (100 μM), and anti-M-CSF blocking antibodies (5 μg/mL) on macrophage reactivity in isolated samples of myenteric plexus. (F) Schematic showing drugs site of action: IL-1β binds to the IL-1 receptor, 43Gap26 blocks Cx43 hemichannels, and anti-M-CSF antibody neutralizes M-CSF. (G) Representative images of immunolabeling for glial cells (GFAP, green) and markers of macrophage activation (MHCII, magenta; CD68, cyan) in samples of colon myenteric plexus that were stimulated in vitro with IL-1β (+ IL-1β) in the presence or absence (control) of 43Gap26 (+ 43Gap26), rat anti-M-CSF blocking antibodies (+ anti-M-CSF), or both (+ 43Gap26 & anti-M-CSF). Scale bar, 100 μm. (H) Quantification of MHCII (top) and CD68 (bottom) labeling, normalized to the untreated controls. Dotted lines show average responses from unstimulated (blue) and IL-1β-stimulated controls (red). We analyzed the data with 2-way ANOVA. Data are shown as mean ± SEM, n = 7 mice; each data point is an average of 4 fields of view (FOV, 593 × 444 μm).
