Figure 1.

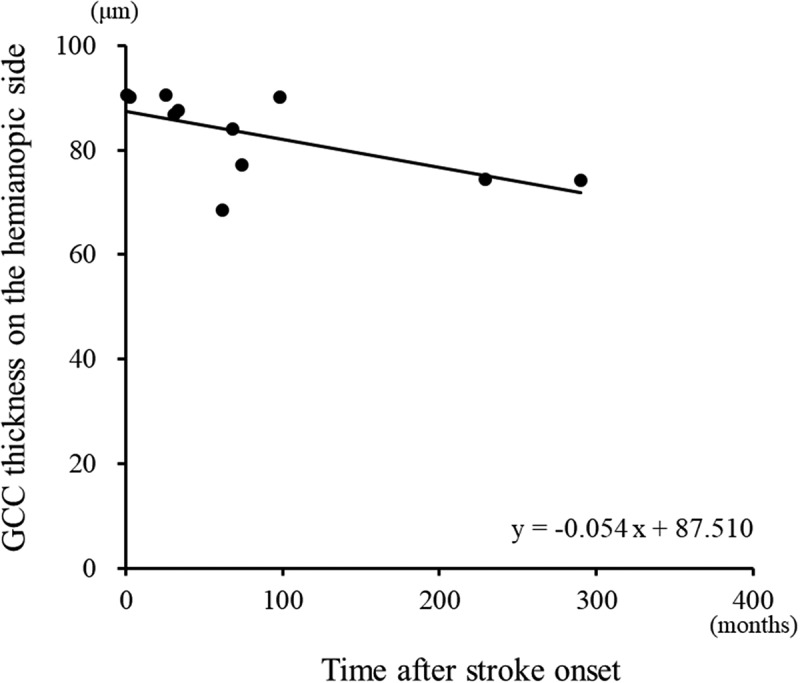
A regression analysis revealed a negative linear relationship (linear regression, r = −0.736, p = .010) between the time after stroke and the GCC thicknesses on the hemianopic side.

A regression analysis revealed a negative linear relationship (linear regression, r = −0.736, p = .010) between the time after stroke and the GCC thicknesses on the hemianopic side.