
Figure 3.
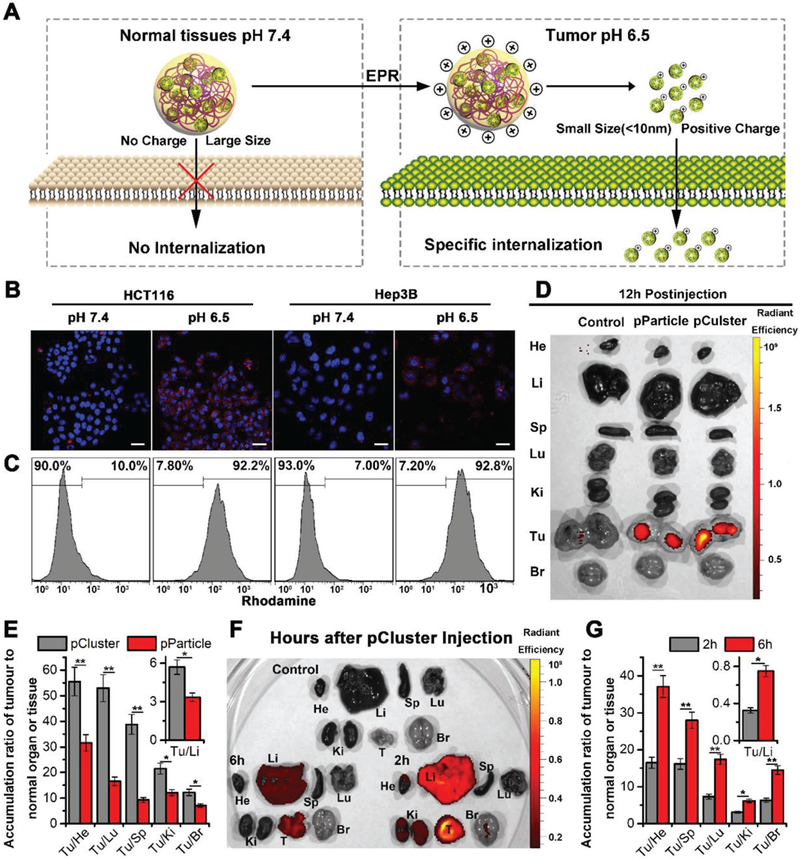
High tumor selectivity of pCluster. A) Schematic depiction for tumor targeting of pCluster. B) Confocal laser scanning microscope (CLSM) images of HCT116 and Hep3B cells after a 6 h incubation with pCluster (20 μg mL−1) at pH 7.4 or pH 6.5, all images were taken under the same exciting light and detector gain (scale bar: 60 μm). C) Cellular uptake of pCluster responded to acidic pH by flow cytometry analysis. D) Ex vivo fluorescent images of tumors and major organs from pParticle- and pCluster-treated mice at 12 h postinjection. He, heart; Li, liver; Sp, spleen; Lu, lung; Ki, kidneys; Tu, tumor; Br, Brain. E) Tumor-to-background (normal organ or tissue) ratios for pParticle and pCluster at 12 h postinjection. pCluster showed much better tumor selectivity than pParticle (n = 3, mean ± s.d.). F) Ex vivo fluorescent images of tumors and major organs from pCluster treated mice at 2 and 6 h postinjection. G) Tumor-to-background (normal organ or tissue) ratios for pCluster at 2 and 6 h postinjection. The latter showed significantly better tumor selectivity than the former (n = 3, mean ± s.d.). p values were calculated by t-test (*p < 0.05; **p < 0.01).