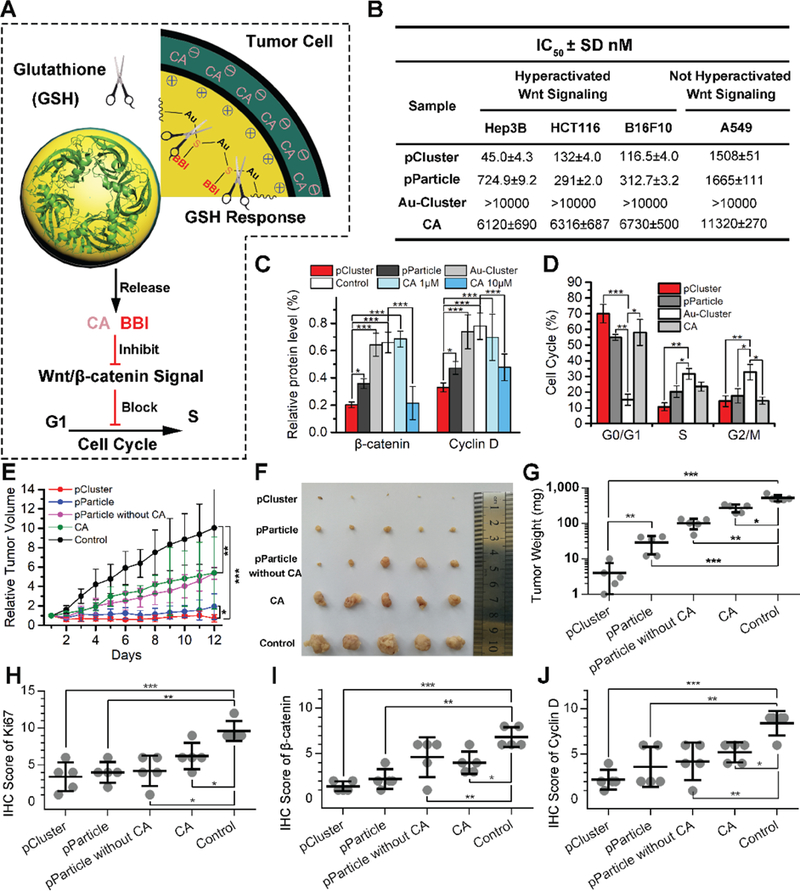
Figure 4.

Antitumor activity of pCluster. A) Schematic depiction of GSH-responded drug release and biological functions of pCluster. B) Effects of pCluster, pParticle, Au-Cluster, and carnosic acid (CA) on the growth of Hep3B, HCT116, B16F10, and A549 cells measured by MTS assay (mean ± s.d., n = 4). C) Western blot analysis was performed to monitor the level of Cyclin D and β-catenin in Hep3B cells with the indicated treatments. All results were performed in triplicate and normalized by the loading control, β-actin. D) Cell cycle distributions were analyzed by flow cytometry in Hep3B cells with the indicated treatments for 24 h (n = 3, mean ± s.d.). E) Tumor growth curve of volume according time during the administration (mean ± s.d., n = 5). Statistically significant differences were judged by Kruskal–Wallis test. F) Photographs and G) weight of tumors collected from mice after 12-day administration. Immunohistochemical (IHC) scores of intratumoral protein levels of H) Ki67, I) β-catenin, and J) Cyclin D. p values were calculated by t-test (*p < 0.05; **p < 0.01; ***p < 0.001).
