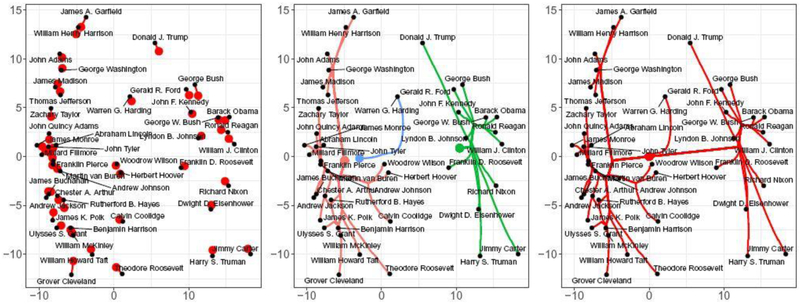
Fig. 5.
Direct visualization of the solution paths produced by carp on the Presidents data, corresponding to unclustered (left), partially clustered (middle), and fully clustered (right) solutions. In each panel, the clusters of pre-modern and modern presidents are clearly visible, as is the outlier status of Harding.

