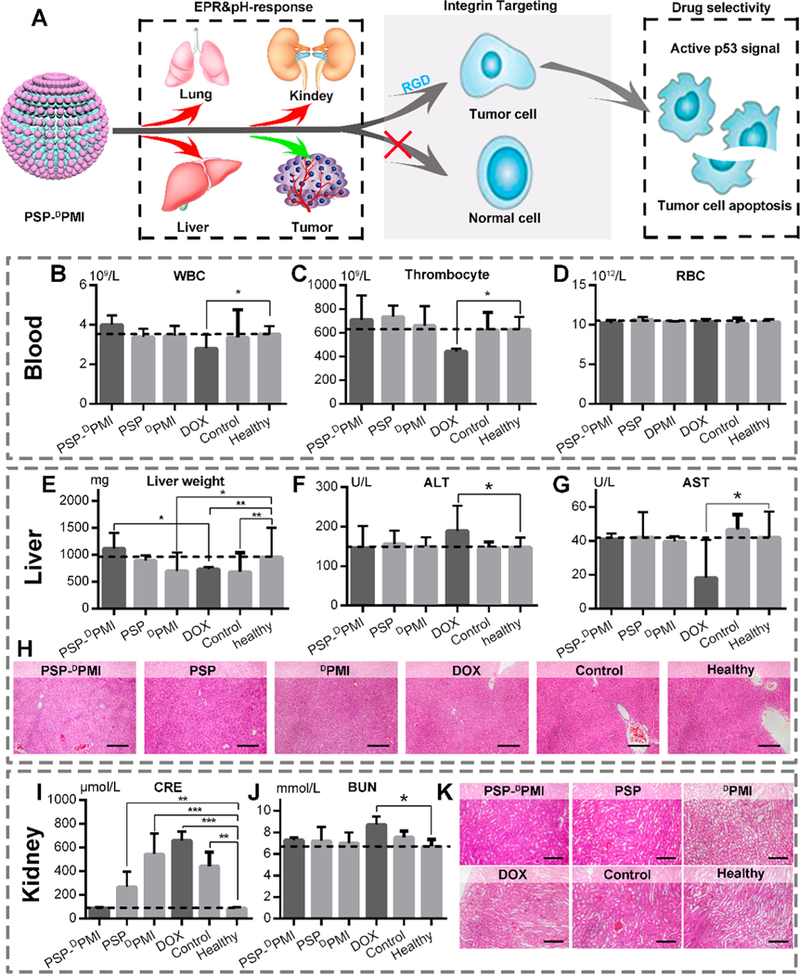
Figure 8.

Safety evaluation of PSP-DPMI in vivo. (A) Diagrammatic view of tumor specificity of PSP-DPMI. (B–D) The count of white blood cells (WBCs), thrombocyte, and red blood cells (RBCs) in mice with the indicated treatments. (E) Liver weight of mice with the indicated treatments. (F, G) The activities of two serum enzymes related to liver function in mice with the indicated treatments. ALT, alanine transaminase; AST, aspartate aminotransferase. (H) The representative H&E staining of liver sections in mice with the indicated treatments (scale bar: 50 μm). (I, J) The measurement of renal function indicators in mice with the indicated treatments. CRE, serum creatinine; BUN, blood urea nitrogen. (K) The representative H&E staining of kidney sections in mice with the indicated treatments (scale bar: 50 μm). Data were presented as mean ± s.e. p values were calculated by t-test (*, p < 0.05; **, p < 0.01; ***, p < 0.001).
