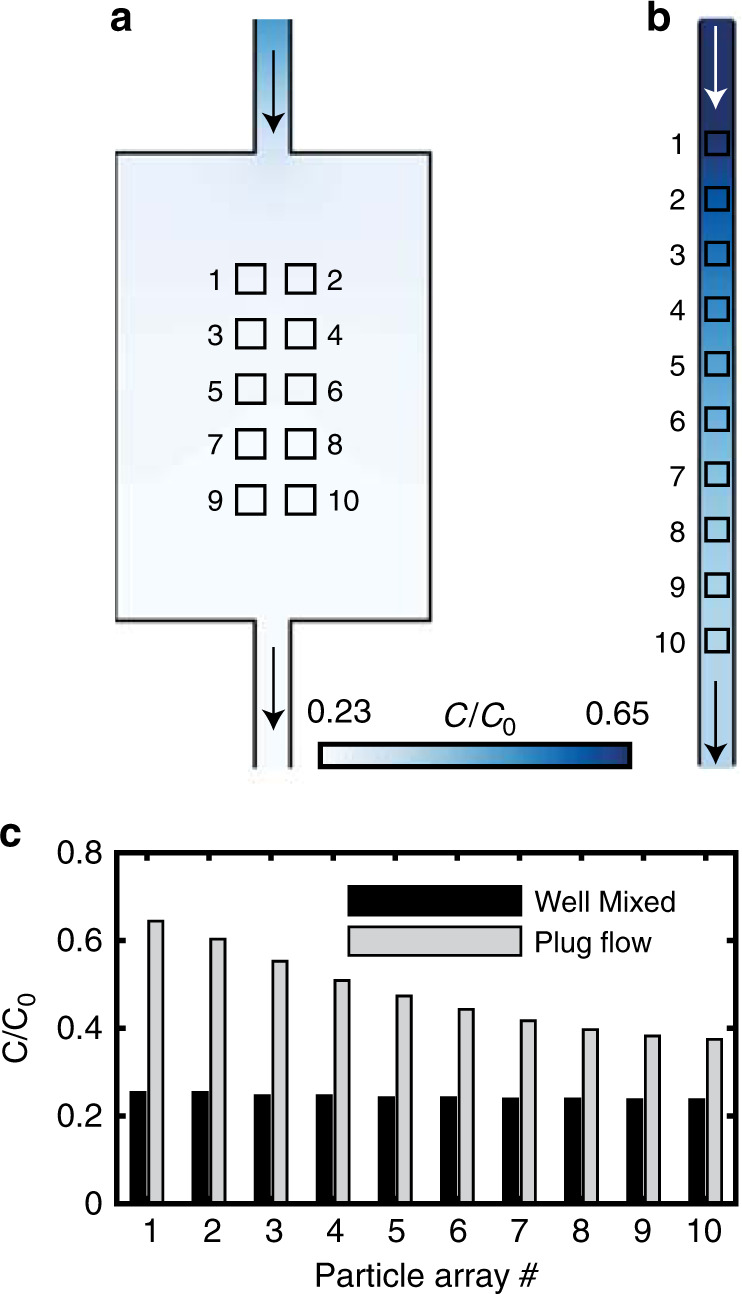
Fig. 2. Simulated O2 concentration profiles inside the two catalyst bed geometries.

Concentration profiles presented as colored surfaces for a the well-mixed reactor and b the plug-flow reactor illustrating the small / large variations in the well-mixed/plug-flow reactor, respectively. c The reactant concentration relative to the inlet (C0) at each of the particle array patches for the two designs. Numbers on the x-axis correspond to the numbers in (a) and (b). In all simulations, the active catalyst is simulated as patches on the wall with a first-order surface reaction, the rate of which (same for both reactor geometries) is chosen so as to match the experimentally observed global conversion over the reactor (see Supplementary Methods for details). The flow through the system was set to 1.5 × 10¹² s−1, based on experimentally measured flow rates.
