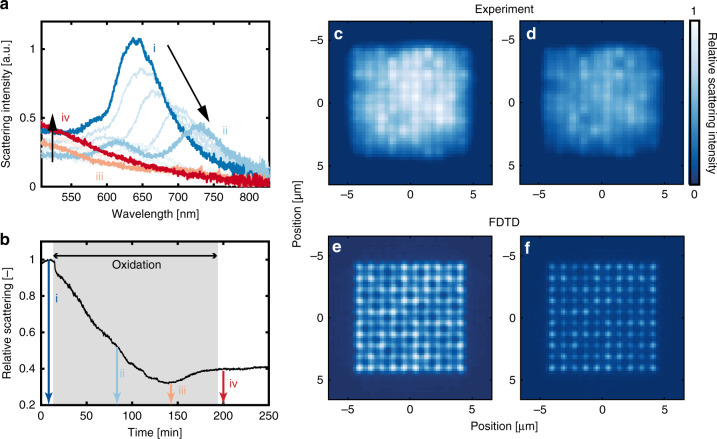
Fig. 3. Optical response of individual Cu nanoparticles during oxidation.
a Scattering spectra from a Cu nanoparticle during oxidation in 0.1% O2 in Ar carrier gas at 200 °C. Four stages of oxidation are highlighted: (i) metallic, (ii, iii) partly oxidized, (iv) bulk oxidized. The arrows indicate how the spectra evolve when going from stage i to ii (right arrow) and from stage iii to iv (left arrow). b Total scattering intensity integrated across the entire wavelength range of 500–850 nm for the same particle as in (a) during oxidation in O2 (shaded area). The three colored arrows correspond to the time of the spectral snapshots presented in (a). c, d Dark-field scattering microscopy image of a 100 Cu nanoparticle array before (c) and after (d) oxidation. e, f FDTD simulated intensity profiles of a 100 Cu nanoparticle array with all particles simulated as metallic Cu (e) or Cu2O (f). The radius of the simulated Cu nanoparticles was randomized (±5 nm) to illustrate the effect of a small size difference on the intensity profiles. The images in (c–f) have been normalized to the same scattering intensity levels.

