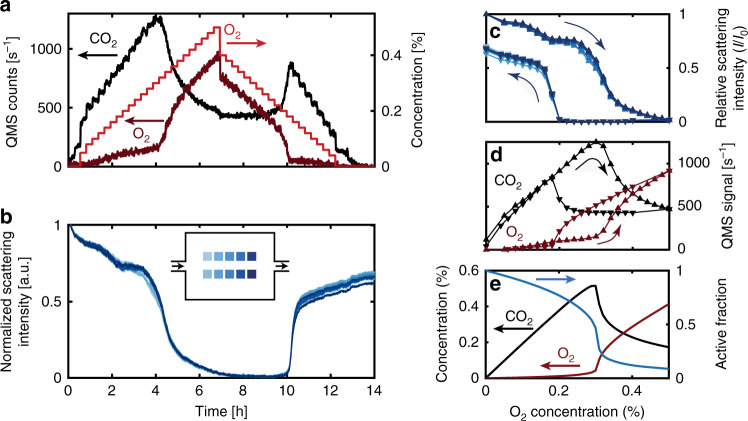
Fig. 4. CO oxidation experiments over 1000 Cu nanoparticles in the well-mixed reactor.
During the entire experiment, the nominal inlet CO concentration was held constant at 7% and Ar was used as the carrier gas and the pressure at the inlet was 4 bar. a Time trace of the nominal O2 inlet concentration in the gas feed (red) and of the outlet concentration of CO2 (black) and O2 (dark red) measured by the QMS. b Scattering intensity time evolution of the ten patches, each comprised of 100 nominally identical Cu nanoparticles. Inset is a schematic of the reactor with the nanoparticle array patches color-coded in blue with respect to their position in the bed. Arrows indicate flow direction. c Patch scattering intensity plotted as a function of nominal inlet O2 concentration during the increase and decrease of the O2 concentration. d Measured CO2 and O2 outlet concentrations plotted as a function of the nominal inlet O2 concentration during the O2 concentration increase (upward triangles) and decrease (downward triangles), respectively. e Simulated CO2 production and active fraction of the catalyst calculated with a microkinetic model for a single continuously stirred tank reactor (CSTR). We note that the x-axis in (c–e) is the same.

