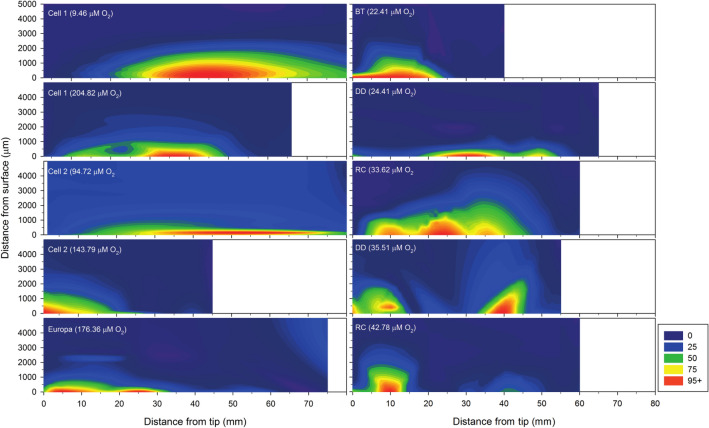
Figure 1.
Contour plots showing the relative concentration of oxygen (% of maximum measured concentration per root, inset value in each graph) of 10 different roots at different points along the longitudinal axis. Left- Empuriabrava FWS-CW. Right- River Daró estuary. Cell 1 and 2- Sampling points 1 and 2 and the treatment cells of the Empuriabrava FWS-CW, Europa Europa Lagoon, BT Bassa de les Tortugues, DD Daró river mouth, RC Rec Coll.

