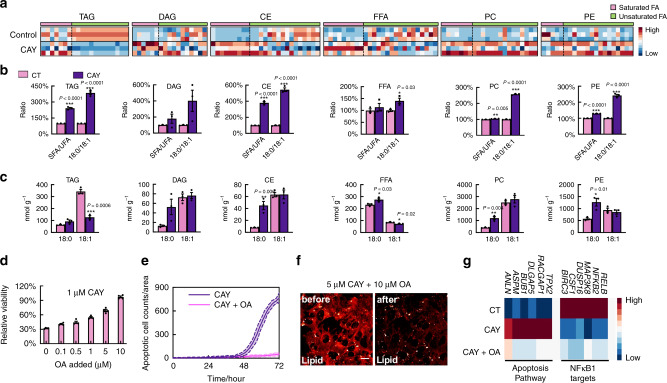
Fig. 6. Lipid regulation upon mono-unsaturation inhibition and cellular rescue with oleic acid (OA) supplementation.
a Heatmap for the relative fatty acid abundances in designated classes of lipids from lipidomics of bulk M381 cells with (CAY) and without (CT) CAY (1 μM, 3 days) treatment. Each row represents a sample replicate and each column represents fatty acyl chains with increasing length and increasing double-bond numbers. SFA and UFA are categorized by pink and green, respectively. The abundance of FA of different chain length is normalized as a Z-score across all six samples within each column. TAG Triacylglycerol, DAG Diacylglycerol, CE Cholesteryl Ester, FFA Free Fatty Acids, PC Phosphatidylcholine, PE Phosphatidylethanolamine. b Overall concentration ratios between SFA to UFA (SFA/UFA), and between ST to OA (18:0/18:1) with CAY (purple) and without CAY (CT, pink, each value is shown as 100% reference) treatment from lipidomics of M381 cells in a (n = 3). c Concentration changes of 18:0 and 18:1 with CAY (purple) and without CAY (CT, pink) from lipidomics in a (n = 3 independent experiments). d Relative viability of M381 cells treated with 1 μM CAY with supplement of OA (18:1) at indicated concentration for 3 days (n = 4 independent experiments). e, Time-lapse apoptotic cell counts of M381 cells after treatment of 1 μM CAY with (pink) or without (purple) 10 μM OA (n = 3 independent experiments, data shown as mean ± error with 95% CI). f SRS imaging at the lipid channel before (left) and after (right) detergent wash on the same set of M381 cells treated with CAY and OA for 3 days. g Ranked pathways from analysis of gene expression trends on control (CT), CAY-treated (middle row, CAY) and CAY plus OA (CAY + OA) M381 cells. Scale bars, 20 μm. Data shown as mean ± SEM. *p < 0.05, **p < 0.01, ***p < 0.001 from two-tailed unpaired t-tests. Lipidomics data are provided as Supplementary Data 1. Source data are provided as a Source data file.

