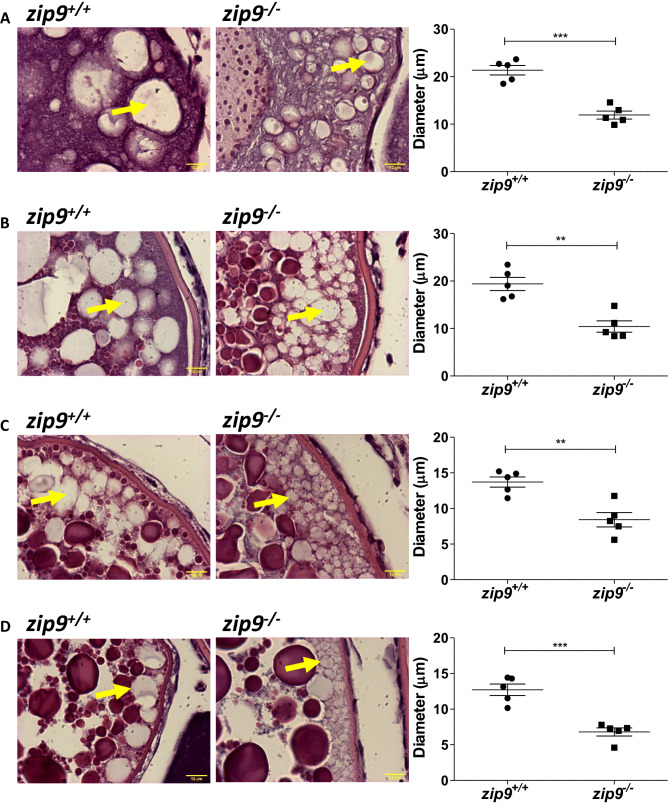
Figure 3.
Morphology of cortical vesicles of zip9+/+ and zip9-/- oocytes throughout oogenesis. Representative images and average cortical vesicle diameters of (A) cortical alveoli, (B) early vitellogenic, (C) mid vitellogenic, and (D) late vitellogenic stage zip9+/+ and zip9-/- oocytes. Arrows indicate location of cortical vesicles. Scale bars: 12 µm. All data represents means ± SEM; n = 5 (average diameter of cortical vesicles for 5 females). Significance was determined by Welch's t-test (**, P < 0.01; ***, P < 0.001).

