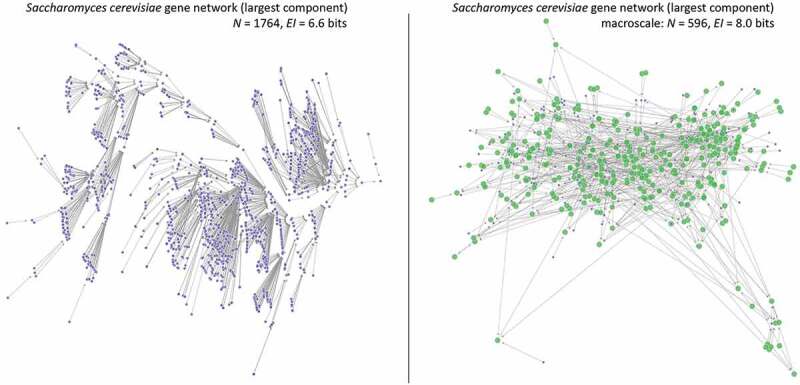
Figure 4.

Macro-scale of Saccharomyces cerevisiae GRN. (Left) The largest component of the Saccharomyces cerevisiae gene regulatory state-space, derived from the Boolean network GRN representation. (Right) The same network but grouped into a macro-scale, found via the greedy algorithm outlined in [48]. There is a ~ 66% reduction in total states and an increase in the network’s EI. Green nodes represent macro-nodes in the new network.
