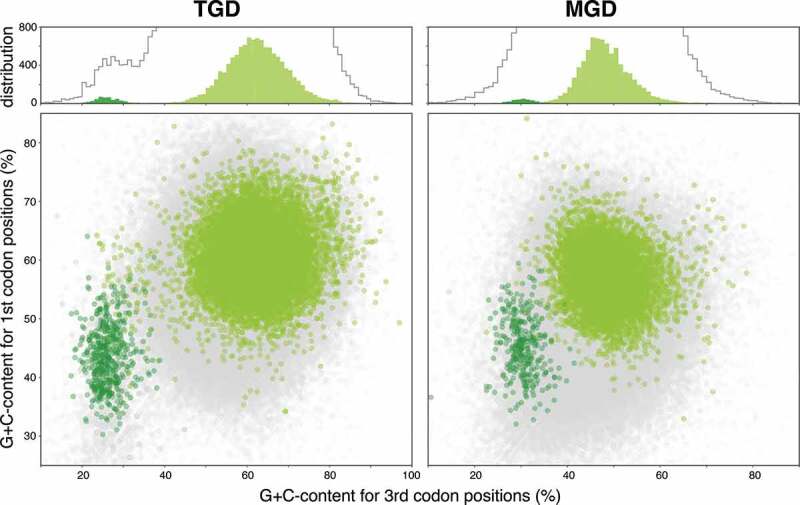
Figure 1.

Scatter plots showing results of prediction for nuclear- and nucleomorph-genome coded green algal genes. Light green and dark green markers in the scatter plots indicate G + C% of genes (transcripts) that are predicted to be coded on nuclear-coded genes and Nm-candidates, respectively. Light gray markers on the bottom layer of the scatter plots show G + C% for total protein genes predicted in the transcriptomes. Histograms on upper part show data distribution on G + C% for third codon positions. Light green and dark green bars indicate the distributions of markers with corresponding colors in the scatter plot, while the gray lines in the histograms represent the distribution of the light gray markers.
