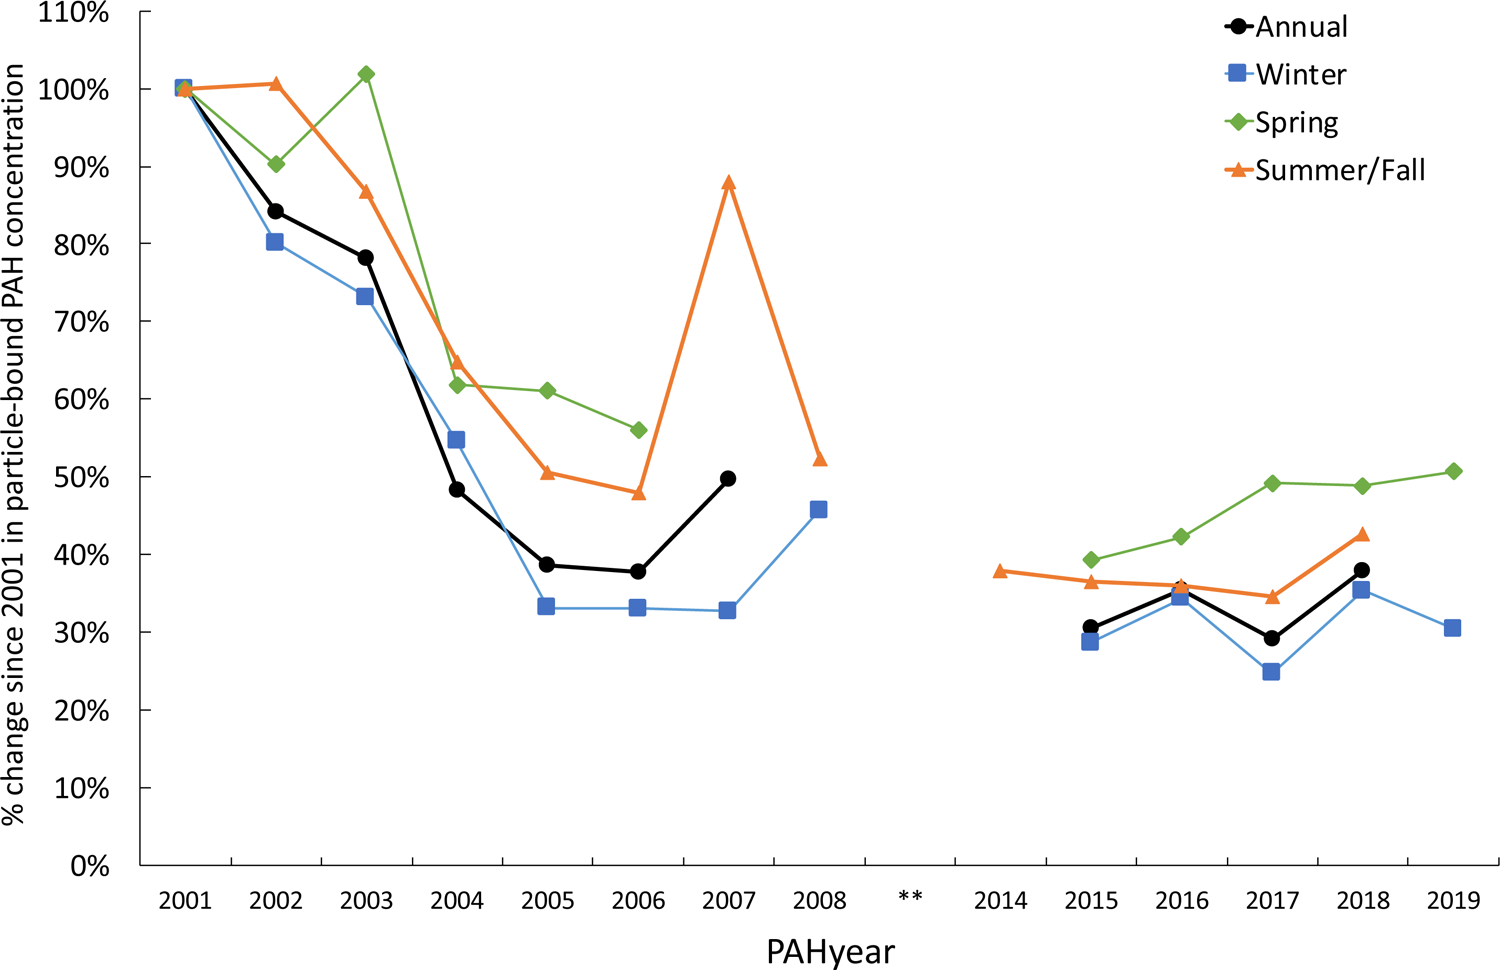
Figure 2.

Annual and seasonal particle-bound PAH (ng/m3) as measured by PAS2000 at the Fresno central site (FSF 2001–2011, FGS 2012–2019), represented as the % of 2001 PAH concentration for comparable year or season [PAH year 2001 (Nov 2000-Oct 2001)].
