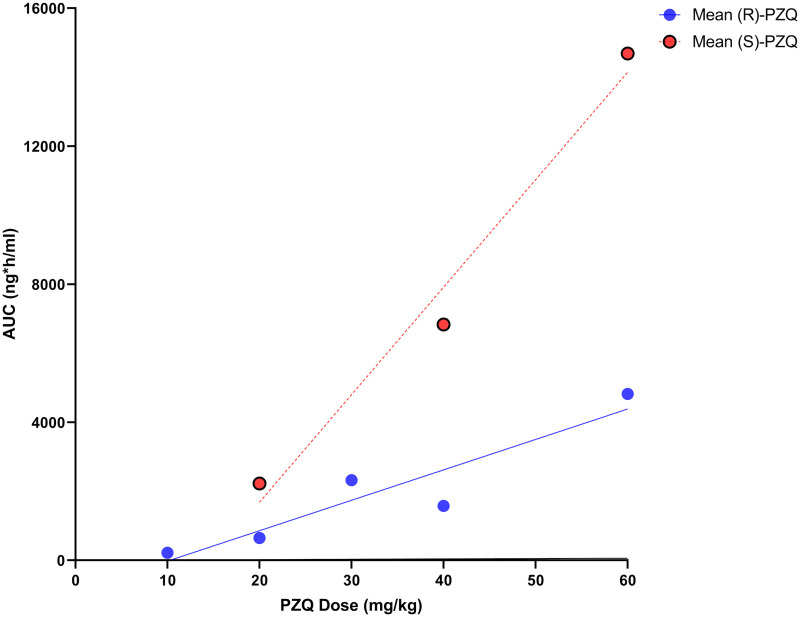
Fig 3. The mean AUC values extracted from the included studies against the PZQ dose of each of the PZQ enantiomers in HNV.
The PZQ enantiomers were measured after a racemic PZQ dose or the (R)-PZQ dosed alone. These data were extracted from multiple papers in this review, separated by PZQ enantiomer, and the AUC was averaged for each dose and plotted on a graph for analysis [51–54]. Using a linear regression model, the difference in AUC between (R)-PZQ and (S)-PZQ in humans was found to be statistically significant (P < 0.05). AUC, area under the curve; HNV, healthy normal volunteers; PZQ, praziquantel.

