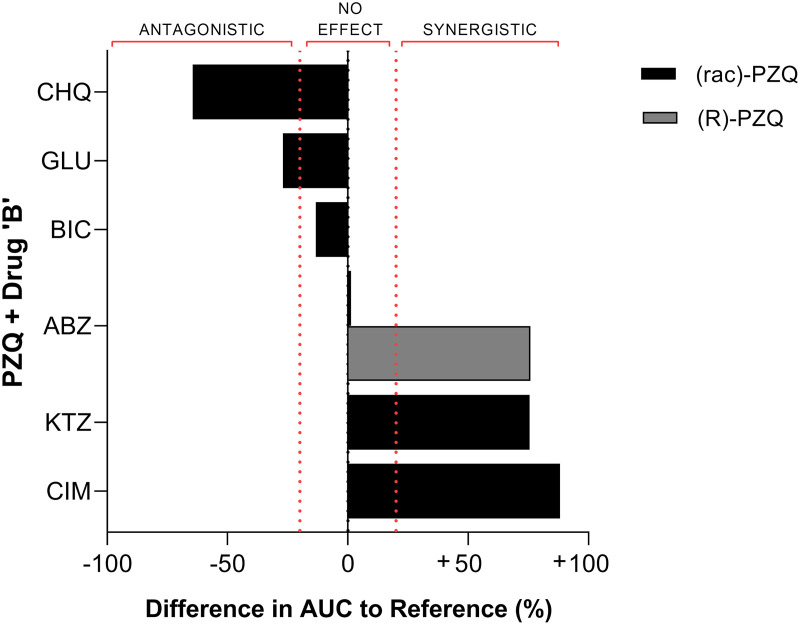
Fig 6. A summary of the human DDIs.
Each bar represents the percentage change in AUC during the drug combination in comparison to PZQ alone. The effect of the drug combination is listed above the bar chart, with ±20% representing the boundaries of no effect due to interindividual variation [87]. The data were extracted from five papers [54, 59, 84–86], compiled in S10 Table, analysed to create percentage change in AUC and then plotted to aid further analysis. ABZ, albendazole; AUC, area under the curve; BIC, bicarbonate; CHQ, chloroquine; CIM, cimetidine; DDI, drug–drug interaction; GLUC, glucose; KTZ, ketoconazole; PZQ, praziquantel.

