
Figure 10.
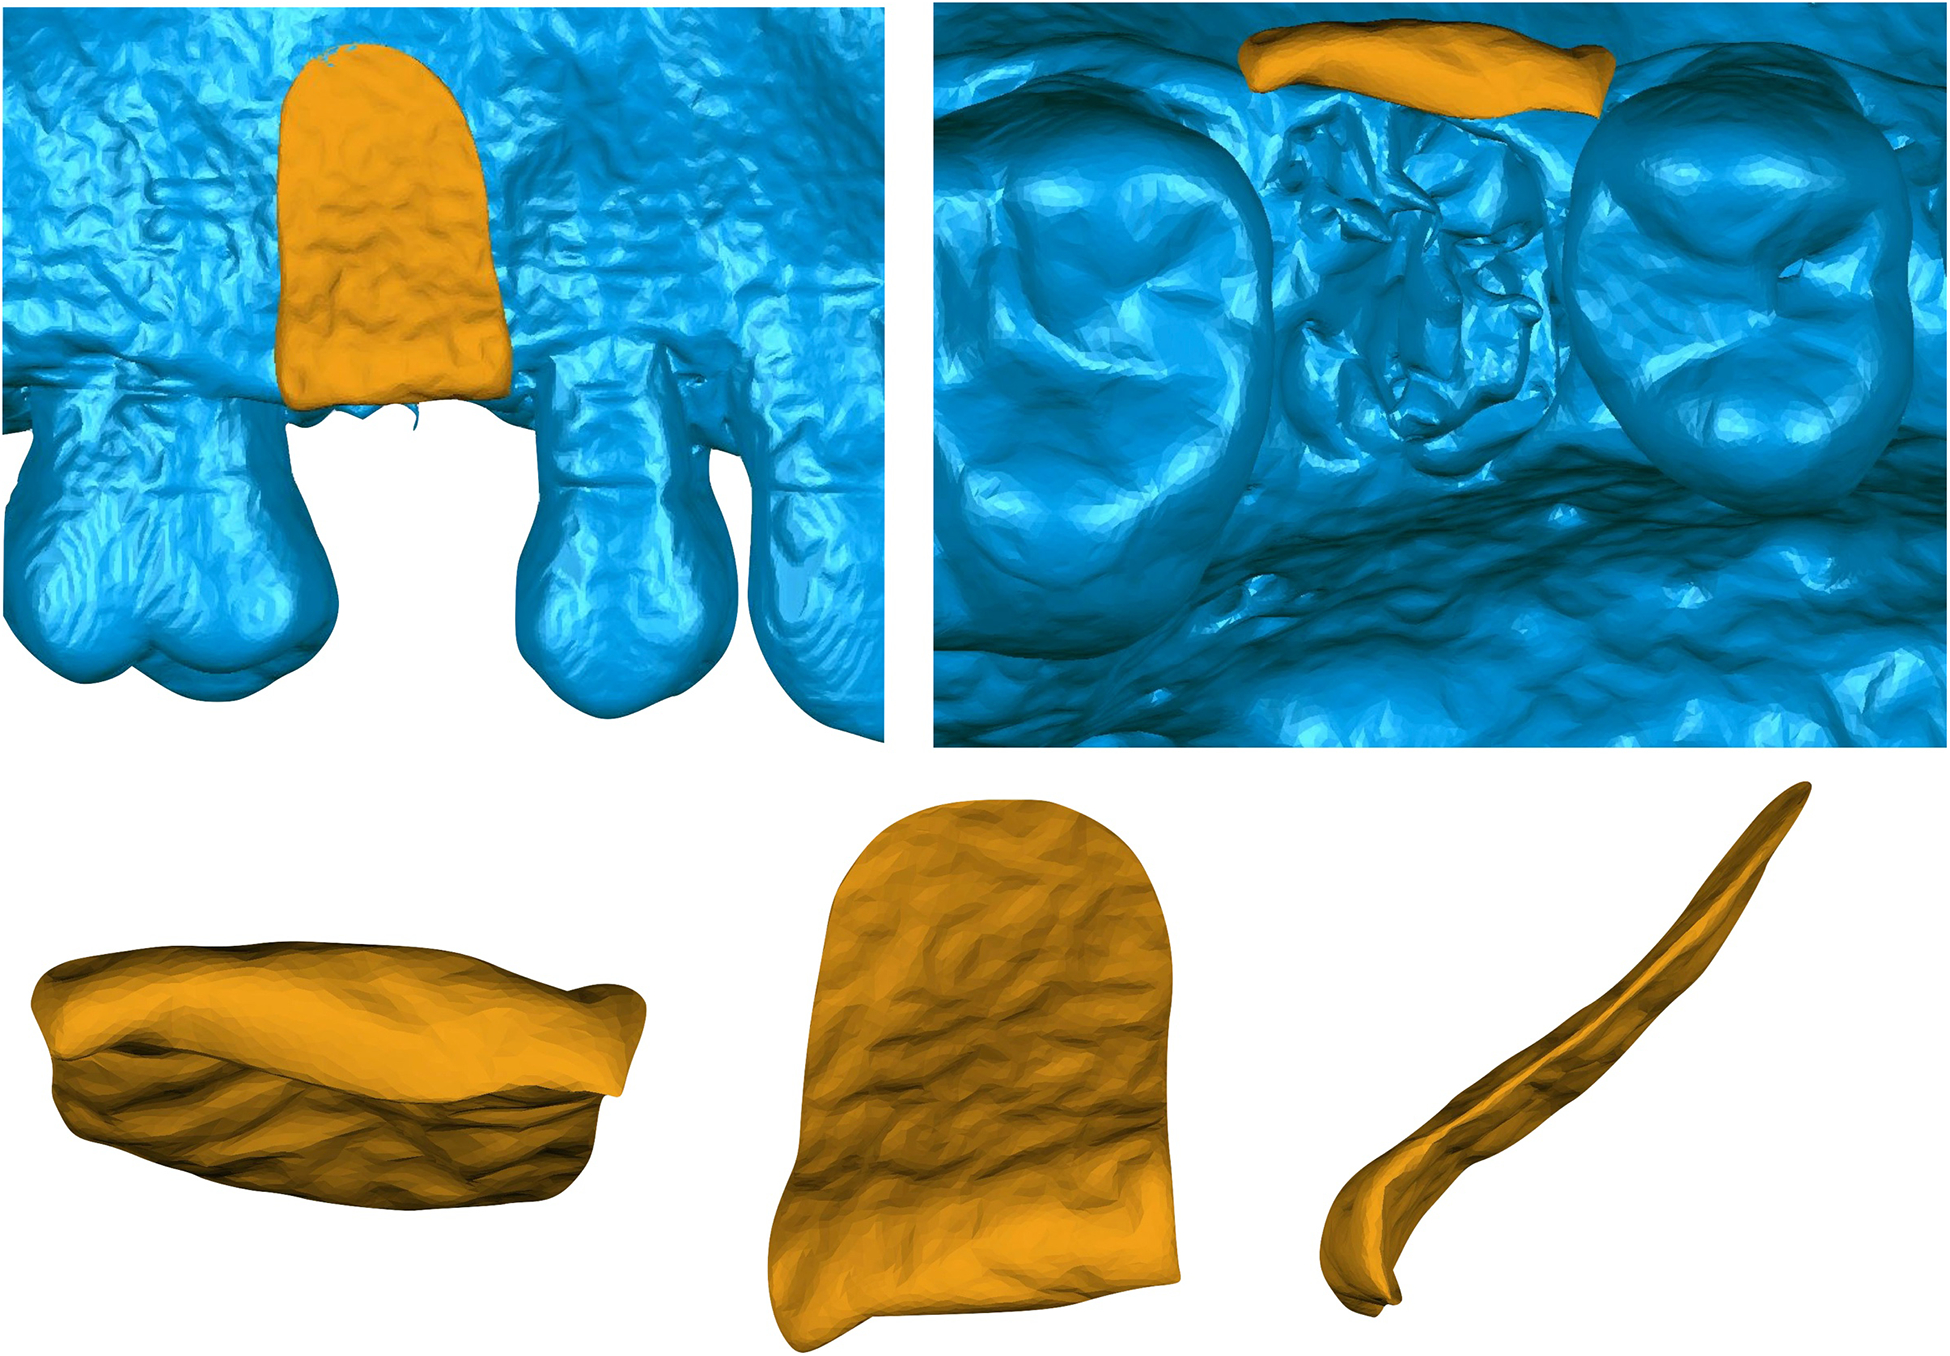
A. Buccal representation of the bone volumetric changes from a xenogeneic collagen matrix treated site. B. Occlusal representation of a 6-month scanned image superimposed with a baseline bone volume at site #4. Isolated representation of the bone volume loss at 6-months from the C. Occlusal, D. Buccal and E. Lateral views.