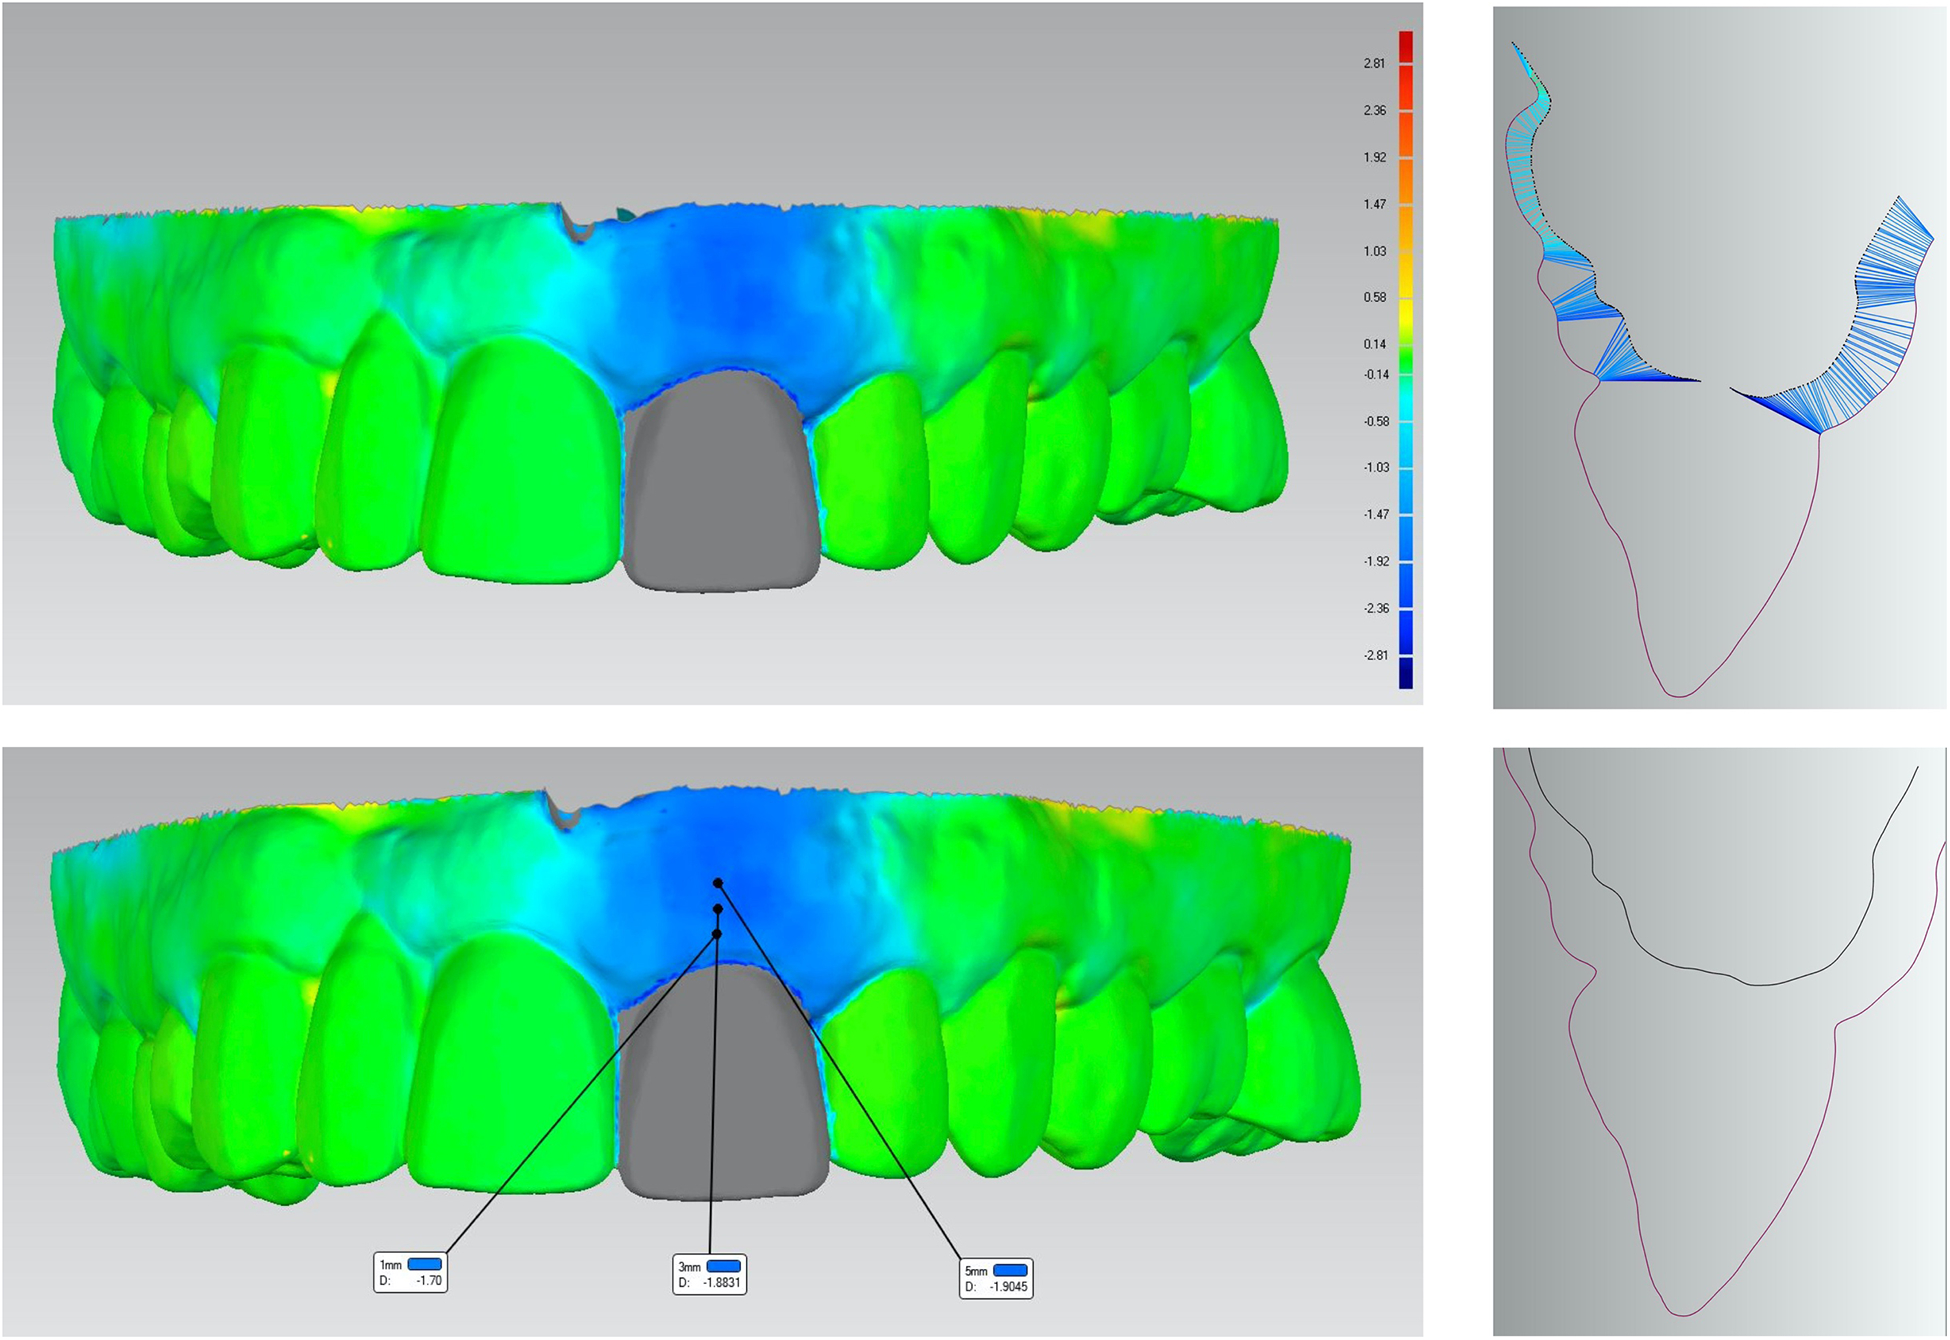
Figure 4.

A. Example of a three-dimensional superimposition of scanned images at baseline and 6-month from the collagen plug group. Colored scale represents the linear soft tissue gain/loss (mm) at the buccal site. B. Cross-sectional image of the mid-buccal position at tooth #9 showing the linear soft tissue loss for both buccal and palatal sites. C. Three-dimensional superimposed scanned images showing the linear gain/loss in soft tissue at 1, 3, and 5mm below the gingival margin. D. Cross-sectional image at the mid-buccal site of tooth #9 showing baseline (red) and 6-month (black) soft tissue contour.
