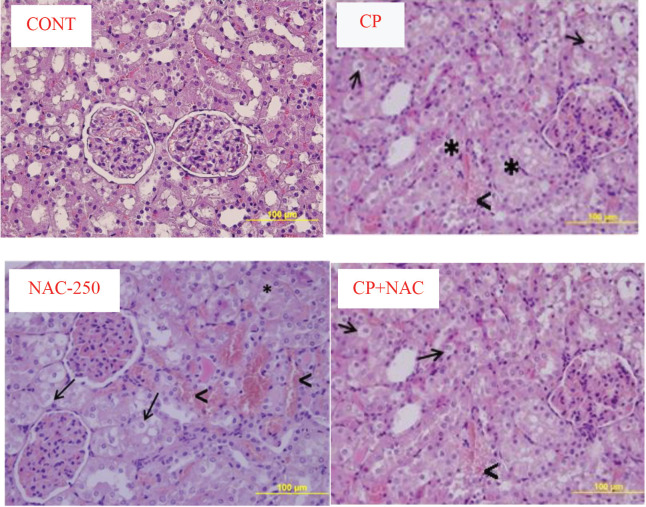
Figure 1.
Morphology of the kidney tissue. Images are representative of the H&E-stained sections of kidneys from the experimental groups. CONT: Kidney tissue showing normal structure in control group; CP: cisplatin-injured kidney tissue obtained from the cisplatin group; NAC-250: NAC-treated group; CP+NAC: kidney tissue obtained from the cisplatin + NAC treated group. Original magnification: 40×, scale bar: 100 μm. Thick arrow (→): hemorrhage; arrowhead (<): interstitial edema; star (*): vacuolization.

