Figure 1.

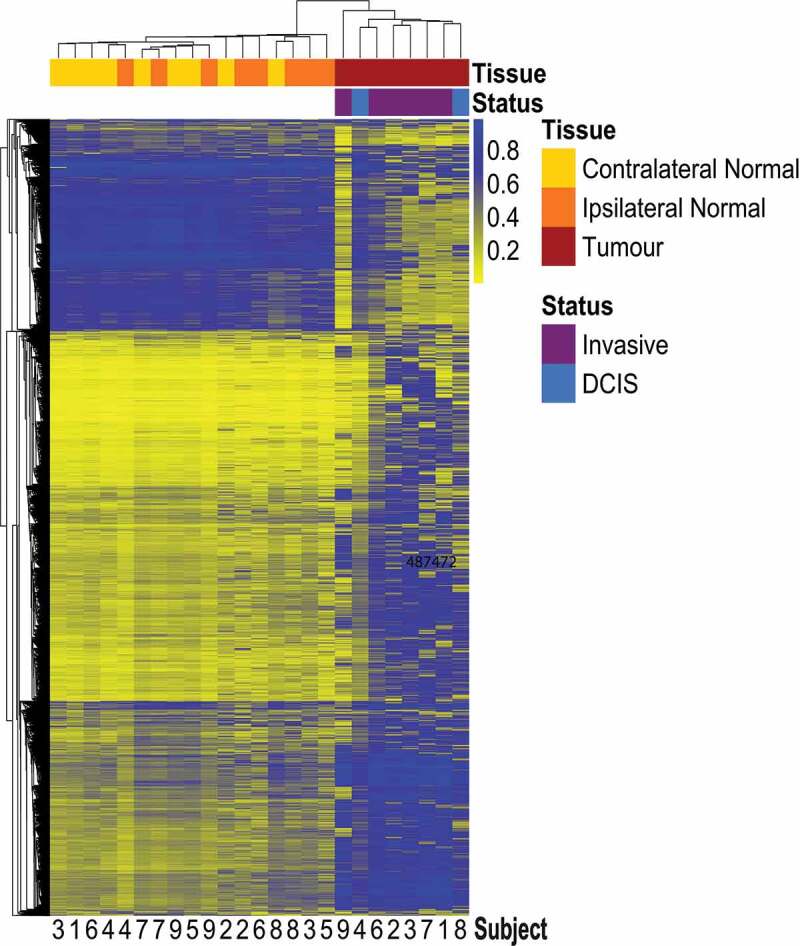
Heatmap with unsupervised hierarchical clustering based on Manhattan distance of tumour, ipsilateral-normal, and contralateral-normal methylation profiles.

Heatmap with unsupervised hierarchical clustering based on Manhattan distance of tumour, ipsilateral-normal, and contralateral-normal methylation profiles.