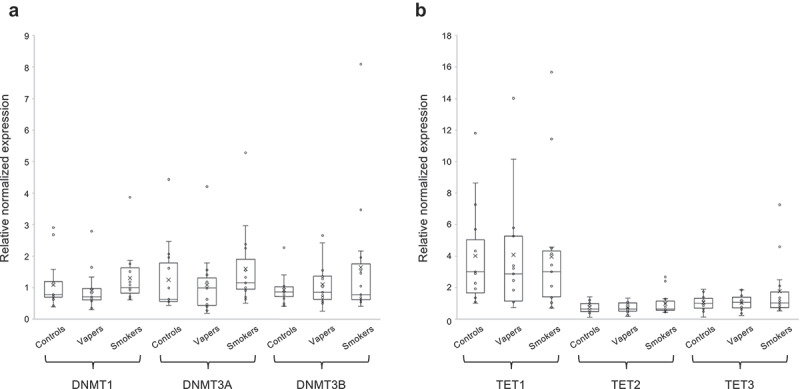
Figure 2.

Expression analysis of DNMTs and TETs. Expression level of DNMTs (DNMT1, DNMT3A, and DNMT3B) and TETs (TET1, TET2, and TET3), catalysing DNA methylation and hydroxymethylation, respectively, were measured in vapers, smokers, and controls by RT-qPCR, as described in the text. All samples were assayed in triplicate. Distribution of data within each group is shown by a combination of scatter plots and box and whisker plots, as described in the legend for Figure 1. Panels A and B show the results of expression analysis for DNMTs and TETs, respectively. The modest changes in the expression level of DNMTs or TETs observed in vapers and smokers relative to controls or relative to each other did not reach a statistically significant level (P < 0.05), as determined by the Wilcoxon Rank-Sum test.
