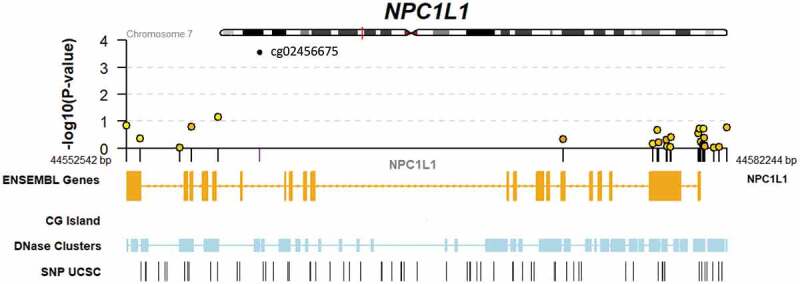
Figure 1.

Genomic context of NPC1L1 responder EWAS results. Upper panel shows a regional Manhattan plot for CpGs within the NPC1L1 gene. Lower panel includes tracks indicating exonic and intronic regions of the gene, CG islands (none present within this region), DNase hypersensitivity regions, and SNPs retrieved from the UCSC genome browser database.
