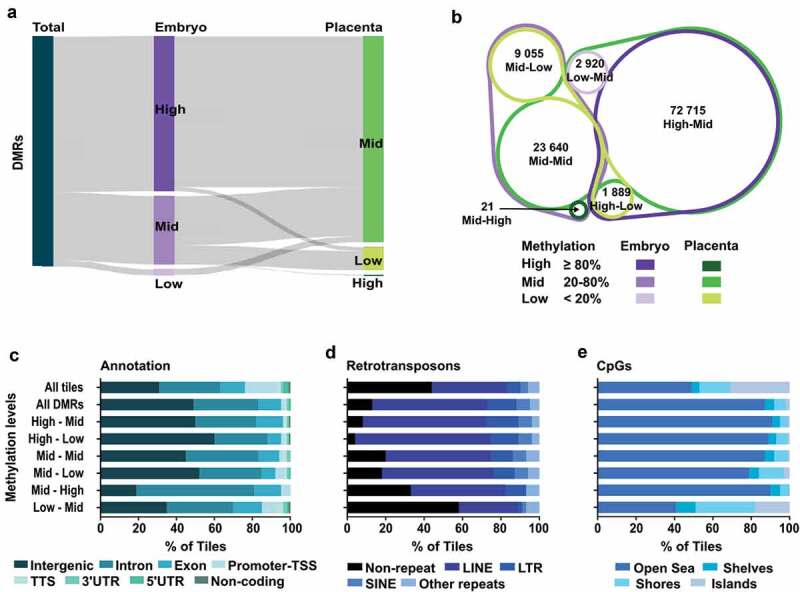
Figure 3.

Distinct genomic features in DMRs based on their methylation status in E10.5 embryo and placenta. DMR analysis by methylation levels in embryo and placenta. (a) Sankey diagram dividing DMRs by methylation levels in embryo (purple) and placenta (green) for the associated tiles. High: ≥80% methylation, Mid (intermediate): ≥20% – <80% methylation, Low: <20% methylation. (b) Venn diagram showing the proportion of tiles in the different DMR categories based on DNA methylation levels between embryo and placenta. (c–e) Analysis of All-tiles, all the DMRs, as well as the six different DMR categories based on levels of DNA methylation in embryo and placenta for: (c) Genomic annotations, (d) Main retrotransposons and (e) Proximity of CpG rich regions. Neighbouring CpG dense regions were defined as shore; up to 2kb away from CGIs, shelf; 2–4kb away from CGIs, and open sea; >4kb away from CGIs.
