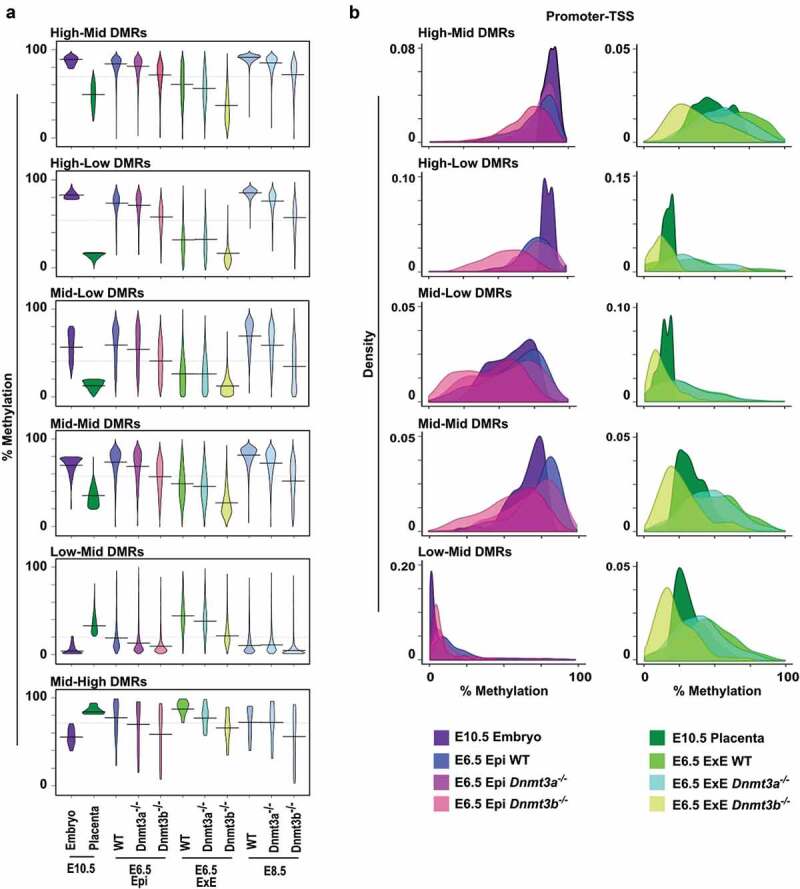
Figure 5.

Dnmt3a- or Dnmt3b-deficiency alters proper establishment of DMR-associated patterns. (a) Violin plots representing DNA methylation distribution and median values of tiles associated with the different DMR categories at E10.5, and their methylation levels in overlapping tiles of different tissues and genotypes at E6.5 [16] and E8.5 [15]. (b) Density plots describing the mean methylation profiles of promoter-TSS associated tiles in each DMR category for E10.5 embryo and E6.5 epiblast (wt, Dnmt3a-/- and Dnmt3b-/-) (left panel) and for E10.5 placenta and E6.5 extraembryonic ectoderm (wt, Dnmt3a-/- and Dnmt3b-/-) (right panel). E: embryo, Epi: epiblast, ExE: extraembryonic ectoderm. See Table S3 for median and mean methylation values, and Table S4 for a number of overlapping tiles analysed.
