
Figure 4.
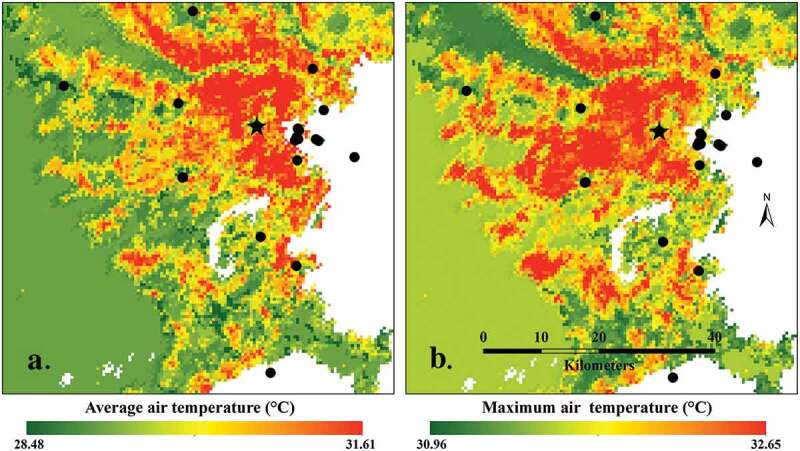
Intraurban temperature variability of “daytime” (0500–1900 hr) air temperatures at a 500 m scale, showing (a) average across the day, and (b) average of the maximum daytime air temperatures, for August 2008–2018 in the Tokyo region using random forests-based regression kriging (RFRK). Circles indicate venue numbers and star is Olympic stadium (see Table 2 & Figure 3 for reference). To clearly show the spatial variations between Figures 4 and 5, the scales of mean temperature and the scales of max temperature are matched.