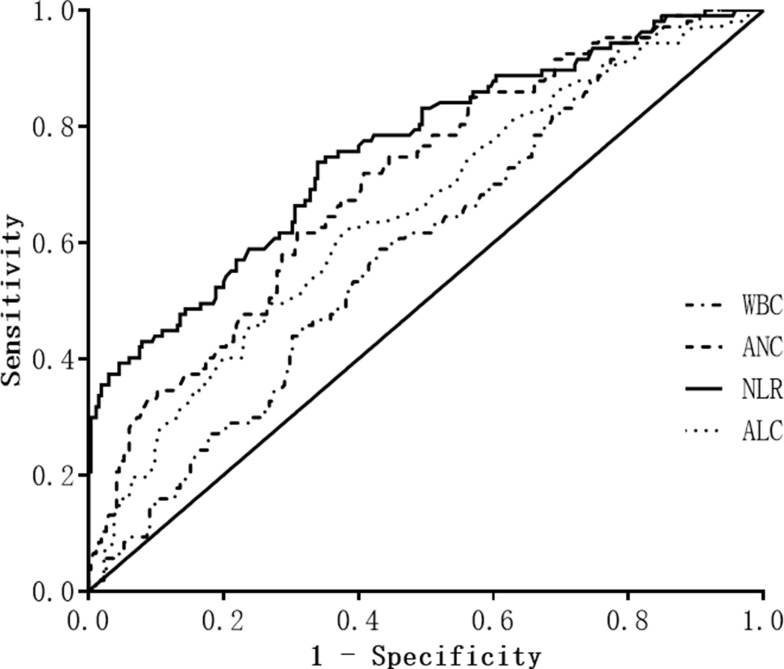
Figure 1.
Receiver operating characteristic curves for predicting of depression following ICH. Predictive values of WBC, ANC and NLR for depression after ICH at 3-month and ALC for non-depression. Area under the curve 0.592 (95% CI, 0.530–0.653; P = 0.006) for WBC; 0.704 (95% CI, 0.647–0.761; P < 0.001) for ANC; 0.758 (95% CI, 0.702–0.814; P < 0.001) for NLR; and 0.649 (95% CI, 0.588–0.711; P < 0.001) for ALC.
Abbreviations: ICH, intracerebral hemorrhage; WBC, white blood cells; ANC, absolute neutrophil count; NLR, neutrophil-to-lymphocyte ratio; ALC, absolute lymphocyte count; CI, confidence interval.

