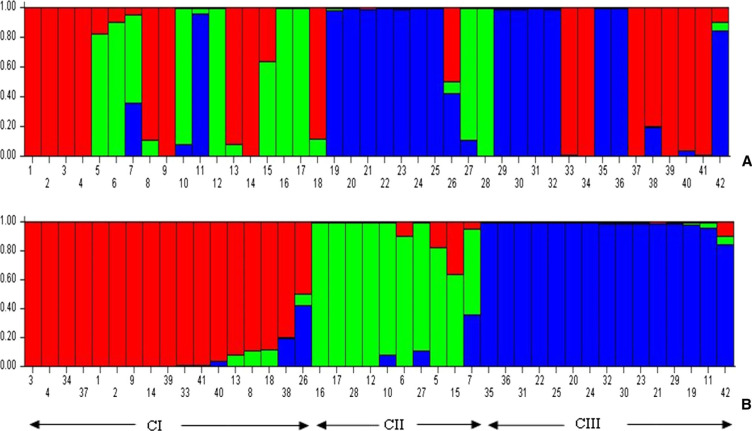
Fig. 4.
a Analysis performed in STRUCTURE 2.2.3 using admixture model with correlated allele frequencies. The clustering profile obtained for K = 3 is displayed as indicated by different colors. b Each of the 42 individuals is represented by a single column broken into colored segments with lengths proportional to each of the K inferred gene pools. Three major clusters of individuals were identified and are indicated by red, green and blue colors (CI = 17, CII = 10 and CIII = 15), and bars with two colors represent individuals that share allelic pools. Membership coefficients (y-axis) are indicated, which were used to allocate individuals into clusters. (Color figure online)

