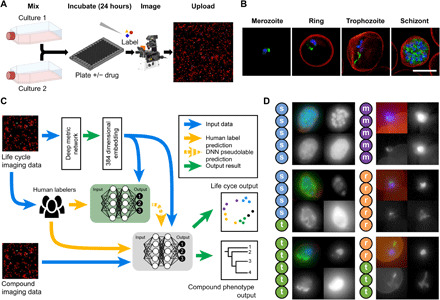
Fig. 1. Experimental workflow.

(A) To ensure all life cycle stages were present during imaging and analysis, two transgenic malaria cultures, continuously expressing sfGFP, were combined (see Materials and Methods); these samples were incubated with or without drugs before being fixed and stained for automated multichannel high-resolution, high-throughput imaging. Resulting datasets (B) contained parasite nuclei (blue), cytoplasm (not shown), and mitochondrion (green) information, as well as the RBC plasma membrane (red) and brightfield (not shown). Here, canonical examples of a merozoite, ring, trophozoite, and schizont stage are shown. These images were processed for ML analysis (C) with parasites segregated from full field of views using the nuclear stain channel, before transformation into embedding vectors. Two networks were used; the first (green) was trained on canonical examples from human-labeled imaging data, providing ML–derived labels (pseudolabels) to the second semi-supervised network (gray), which predicted life cycle stage and compound phenotype. Example images from human-labeled datasets (D) show that disagreement can occur between human labelers when categorizing parasite stages (s, schizont; t, trophozoite; r, ring; m, merozoite). Each thumbnail image shows (from top left, clockwise) merged channels, nucleus staining, cytoplasm, and mitochondria. Scale bar, 5 μm.
