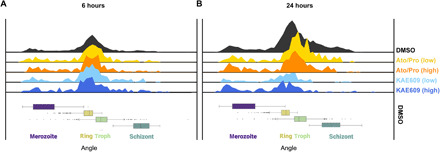
Fig. 3. Quantifying on-cycle drug effects.

Asynchronous Plasmodium falciparum cultures were treated with the ATPase4 inhibitor KAE609 or the combinational MITO treatment of atovaquone and proguanil (Ato/Pro) with samples fixed and imaged 6 (A) and 24 (B) hours after drug additions. Top panels show histograms indicating the number of parasites across life cycle continuum. Compared to DMSO controls (topmost black histogram), both treatments demonstrated reduced parasite numbers after 24 hours. Shown are four drug/concentration treatment conditions: low-dose Ato/Pro (yellow), high-dose Ato/Pro (orange), low-dose KAE609 (light blue), and high-dose KAE609 (dark blue). Box plots below demonstrate life cycle classifications in the DMSO condition of images from merozoites (purple) to rings (yellow), trophozoites (green), and finishing with schizonts (dark green).
