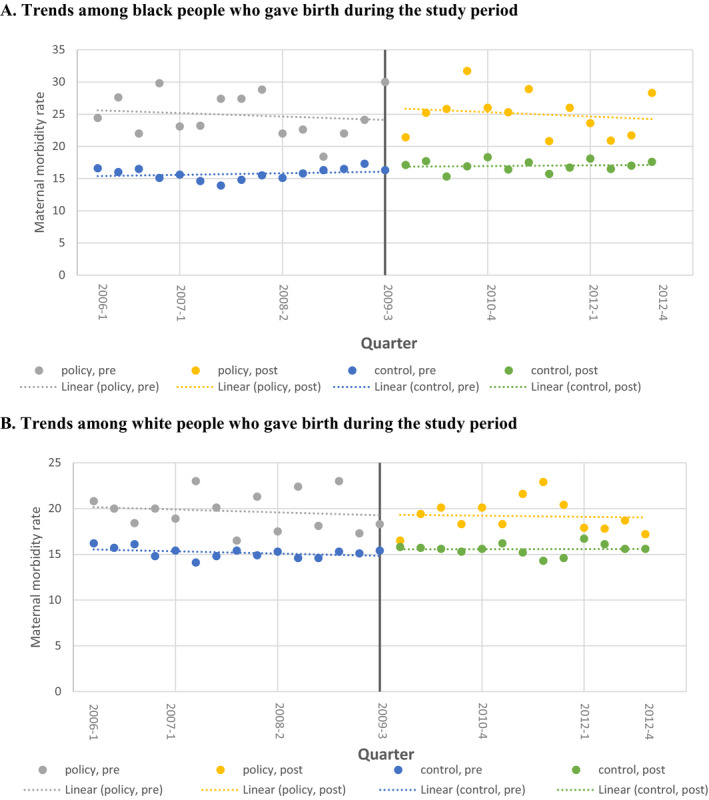
FIGURE 2.

Quarterly trends in composite maternal morbidity among black (A) and white (B) Medicaid fee‐for‐service beneficiaries in Minnesota (Policy State) and six control states, 2006‐2012† [Color figure can be viewed at wileyonlinelibrary.com]
note: A, Trends among Black people who gave birth during the study period. B, Trends among White people who gave birth during the study period.
†Heavy vertical bar indicates policy implementation (October 1, 2009)
