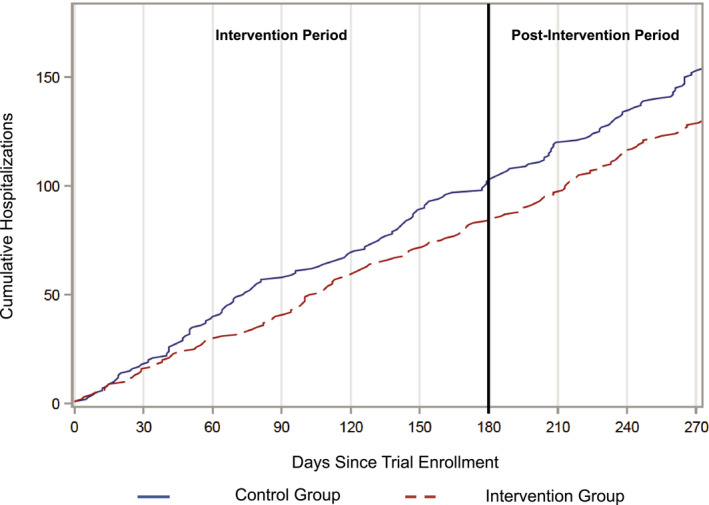
FIGURE 2.

Cumulative Hospitalizations Over 9 months Following Enrollment [Color figure can be viewed at wileyonlinelibrary.com]
Notes: This graph shows the cumulative number of hospitalizations for patients in the intervention control groups in the nine months following enrollment, including the six‐month IMPaCT intervention period and a three‐month postintervention period. This graph uses only data from trials 2 and 3, for which longitudinal hospitalization data were available.
