
Fig. 5. Selection coefficients and conditional differentiation at Optix-bound CREs.
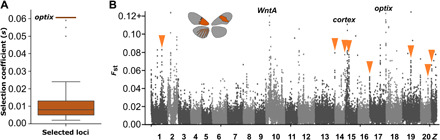
(A) Plot shows the estimated selection coefficients derived from alpha produced by SweepFinder2; outlier from the dome/wash locus is not shown (s = 0.082). Red bar indicates the largest selection coefficient in the optix locus. (B) Evidence of moderately strong genomic differentiation at Optix-bound loci provides support for a model incorporating conditional differentiation. Orange arrowheads highlight Optix-bound loci with Fst greater than 0.04.