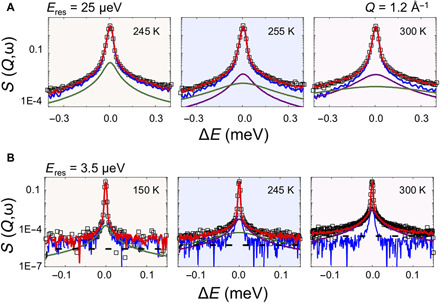
Fig. 2. QENS analysis of PTI·H2O.

(A and B) QENS data and their analyses shown at Q = 1.2 Å−1. Top panels were obtained at OSIRIS, ISIS, UK (Eres = 25 μeV), and the lower panel data were recorded at IN16B-BATS, ILL, Grenoble, France (Eres = 3.5 μeV). The global fit (red continuous curve) is overlain on the data points (black). Lorentzian fits to the QENS data after removal of the instrumental resolution profile convoluted with the elastic δ(ω) function are shown as continuous curves. Localized nanoconfined librational motions observed at 150 K in the high-resolution IN16B data are indicated by the green curve. The background function recorded at 5 K is shown underneath in blue. Localized dynamics are also detected in the OSIRIS data at 245 K. Above 255 K, c-o-m translational diffusion is observed in the OSIRIS QENS analysis (magenta), along with a broader contribution from pseudo-rotational/localized relaxation contributions (green curve). Additional S(Q,ω) datasets from the different instruments are shown in fig. S1.
