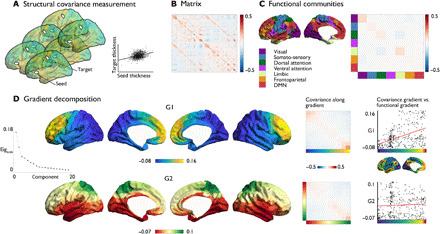
Fig. 1. Large-scale organization of structural covariance.

(A) Measuring structural covariance of thickness. (B) Structural covariance matrix using 400 Schaefer parcels (25). (C) Mean correlation within functional network community (23). DMN, default mode network. (D) Gradient decomposition. Left: Principal (G1) and second (G2) macroscale gradient of structural covariance. Middle: Structural covariance strength within and between gradient bins (10 bins). Right: Correlation of G1 and G2 with the principal gradient of resting-state fMRI (28).
