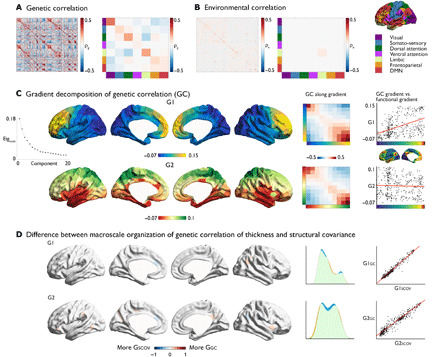
Fig. 2. Large-scale organization of genetic correlation of cortical thickness.

(A) Left: Genetic correlation of local cortical thickness in the Schaefer parcellation (25). Right: Mean genetic correlation within/between functional communities (23). (B) Left: Environmental correlation of cortical thickness. Middle: Mean environmental correlation within/between functional communities (23). Right: Functional communities (23). (C) Gradient decomposition. Left: Principal (G1) and second (G2) macroscale gradient. Middle: Average genetic correlation within and between gradient bins (10 bins). Right: Correlation between G1 and G2 and principal gradient in resting-state fMRI (28). (D) Left: Parcel-wise difference between the structural covariance gradients (GSCOV) and the genetic correlation gradients (GGC). Blue indicates higher gradient ranking in GSCOV, and red indicates higher gradient ranking in GGC. Middle: Density plots (blue, GSCOV; green is overlap; red, GGC) and Right: Scatter of the structural covariance and genetic correlation gradients.
