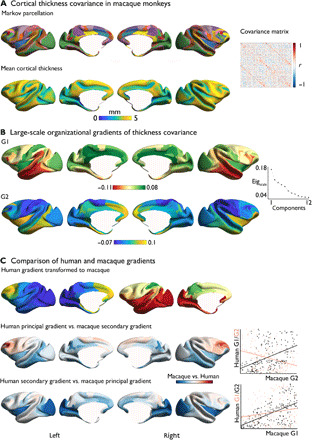
Fig. 3. Structural covariance gradient in macaque monkeys.

(A) Top: Markov parcellation (32). Bottom: Mean cortical thickness in 41 macaques from three independent sites (Davis, Oxford, and Newcastle). Right: Structural covariance of thickness matrix in macaques. (B) Gradient decomposition: primary gradient (G1) and secondary gradient (G2) of the structural covariance matrix. (C) Comparison of human and macaque gradients. Red indicates a higher gradient ranking in humans, whereas blue indicates a higher gradient ranking in macaques. Scatter plots indicate the association between human posterior-anterior covariance gradient (G1, black) and human inferior-superior covariance (G2, red) and macaque principal gradient (G1, top scatterplot) and secondary gradient (G2, bottom scatterplot).
