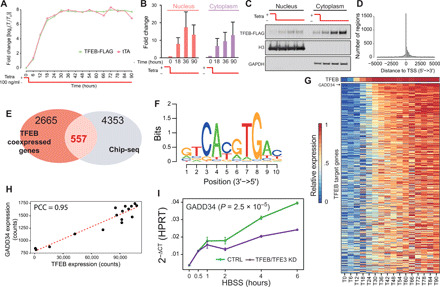
Fig. 1. Identification of TFEB direct targets following TFEB overexpression.

(A) Characterization of inducible expression system in human embryonic kidney (HEK) 293 cells with genomic integration of the expression cassette in fig. S2. Exogenous TFEB-FLAG and tTA transactivator levels measured at the indicated time points by quantitative real-time polymerase chain reaction (qRT-PCR). (B) Quantification by densitometry of (C) immunoblotting assay (WB) of TFEB-FLAG in nuclear and cytoplasmatic fractions at the indicated time points expressed as fold change relative to time 0. (D) Distribution of TFEB binding sites detected by ChIP-seq relative to the transcription start site (TSS). (E) Selection of 557 bona fide TFEB direct targets and (F) de novo motif finding in their proximal promoter revealing the CLEAR binding site. (G) Expression levels of the 557 TFEB direct targets at increasing TFEB-FLAG levels at the indicated time points. Genes are ordered according to their correlation with TFEB-FLAG expression. (H) Scatter plot of GADD34 versus TFEB-FLAG expression levels. (I) qRT-PCR of the indicated gene during amino acid deprivation in untreated cells (control, CTRL) or following small interfering RNA–mediated knockdown (KD) of TFEB and TFE3 (TFEB/TFE3 KD); P value refers to two-way analysis of variance (ANOVA) after post hoc correction.
