
Fig. 4. GADD34 activity is required for the starvation-induced transcriptional program to be implemented at the protein level.
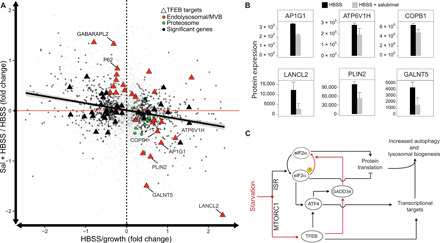
(A) Quantification of neosynthesized proteins by LC-MS following bio-orthogonal amino acid tagging with AHA for 6 hours in the following conditions: full medium (growth) and 6-hour amino acid starvation (HBSS) with or without salubrinal (Sal). Each protein is shown as a dot whose coordinates are the relative (fold) change following starvation alone (HBSS/growth – x axis) or starvation in the presence of 100 μM salubrinal (HBSS + Sal/HBSS – y axis). For each condition, the average fold change was computed from five independent samples. The trend line is shown as a solid black line. The dashed vertical line separates proteins increasing following starvation (right) from those decreasing (left). The red horizontal line separates proteins for which Sal treatment in starvation resulted in increased protein levels with respect to starvation alone (top) from those which resulted in decreased protein levels (bottom). Of 3667 proteins detected in all the samples (gray dots), HBSS treatment alone significantly changed 968 proteins (black dots). (B) Quantification of changes in protein levels measured as described in (A) for selected TFEB targets following starvation in the absence (black) or presence (gray) of salubrinal (P < 0.1). (C) Model of TFEB-mediated regulation of protein translation during starvation.