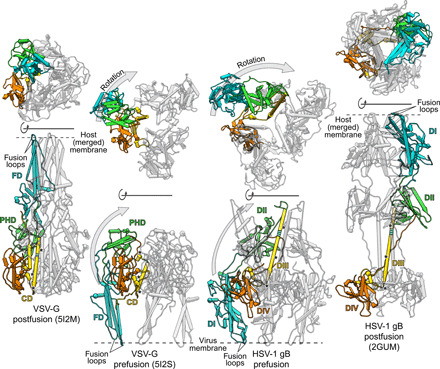
Fig. 5. Comparison of the domain rearrangement between pre- and postfusion conformation in VSV-G and gB.

The structures of VSV-G (11, 12) and HSV-1 gB (6) are shown in side (lower row) and top (upper row) views in pipe representation with one protomer colored as in Fig. 1A. For clarity, DV of gB is omitted, and to increase visibility, one protomer is framed by a black silhouette. The prefusion conformation of each protein is depicted in the middle with the postfusion conformation on the sides. The pre- and postfusion conformation of each structure is aligned to the region including DIV (orange) and the C-terminal helix of DIII (yellow) in gB or the CD region in VSV-G, respectively. The one-sided gray arrows indicate the movement of DI (blue) and DII (green) in gB and the corresponding FD (blue) and PHD (green) in VSV-G in relation to the rest of the protein with the upward movement shown in the side views and the lateral movement shown in the top views. The hinge regions in DIII of gB and the CD in VSV-G are shown in striped green with the conserved sequence signatures marked by black asterisks.
