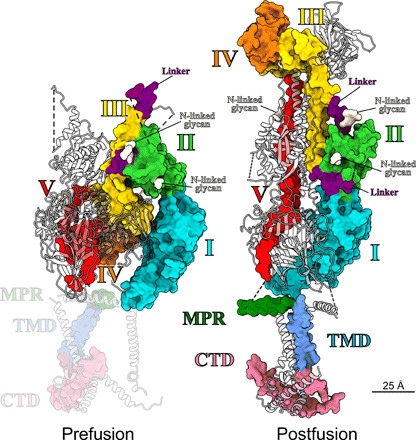
Fig. 6. Domain architecture of the pre- and postfusion conformation.

Structure of the rigid-body fit for the prefusion conformation in comparison to the full-length postfusion structure. Domains are marked and colored as in (14), also indicating representative positions of potential N-linked glycosylations. Two protomers per structure are shown as gray ribbons. For clarity, ribbons are half transparent. Because of the uncertainty of the fit, the MPR, TMD, and C-terminal domain (CTD) of the prefusion structure are shaded.
