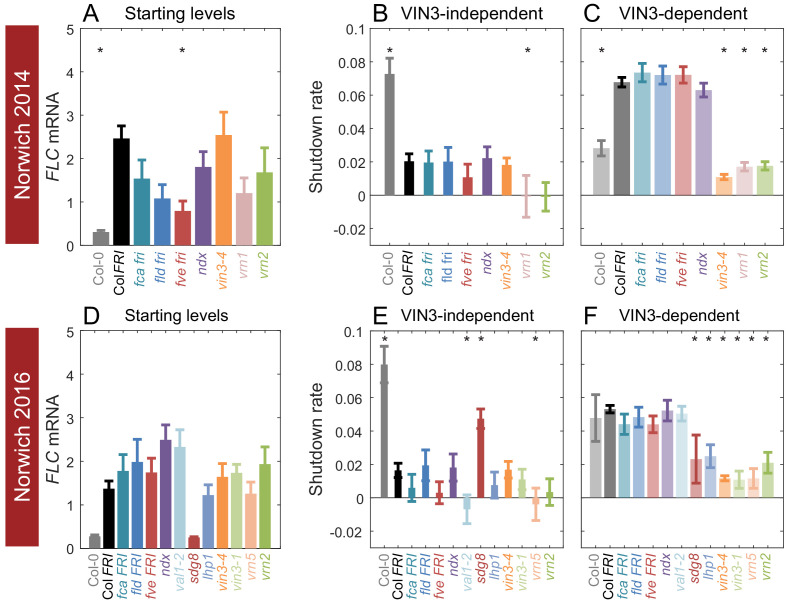
Figure 4. Starting levels and rates of downregulation of FLC in mutants and transgenics in field conditions in Norwich, UK.
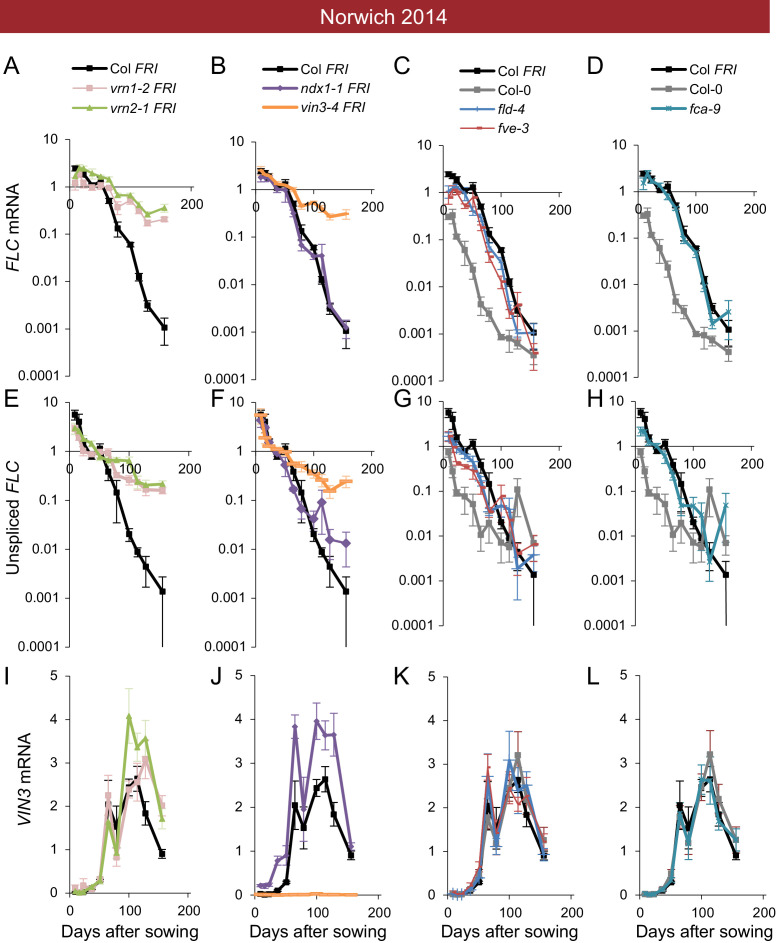
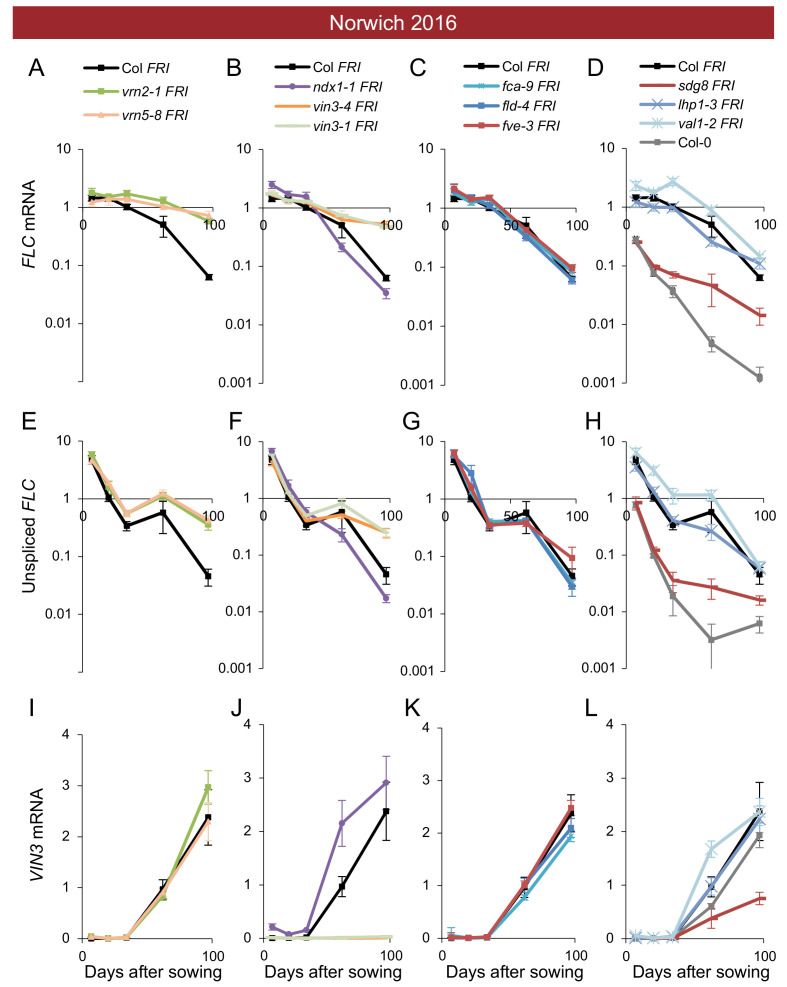
(A–F) FLC downregulation analysed as level at first time point (Starting levels, A, D), rate of downregulation before induction of VIN3 expression (VIN3-independent, dark bars, B, E) and rate of downregulation after VIN3 induction (VIN3-dependent, translucent bars, C, F). Features of genotypes that are significantly different to the reference line Col FRI are indicated by * (for Starting levels, ANOVA with Dunnett’s post-hoc test, for Shutdown rates, Satterthwaite’s t-tests on REML Linear mixed model). p-values for all comparisons are given in Supplementary file 1. Rates of downregulation are given in units of ‘a.u. per day’, where the arbitrary units (a.u.) correspond to the normalised concentration of FLC mRNA. VIN3 induction started at: Norwich 2014, ~58 days, see (Figure 4—figure supplement 1); Norwich 2016, ~48 days, see (Figure 4—figure supplement 2). All mutants are in the Col FRI background unless otherwise stated. Expression data were normalised to the corresponding control sample (for 2014–5 or 2016–7, see Materials and methods). N = 6 except where samples were lost to death or degradation (see Materials and methods and Source data 2 and 3). Error bars show s.e.


