. 2020 Sep 9;9:e57671. doi: 10.7554/eLife.57671

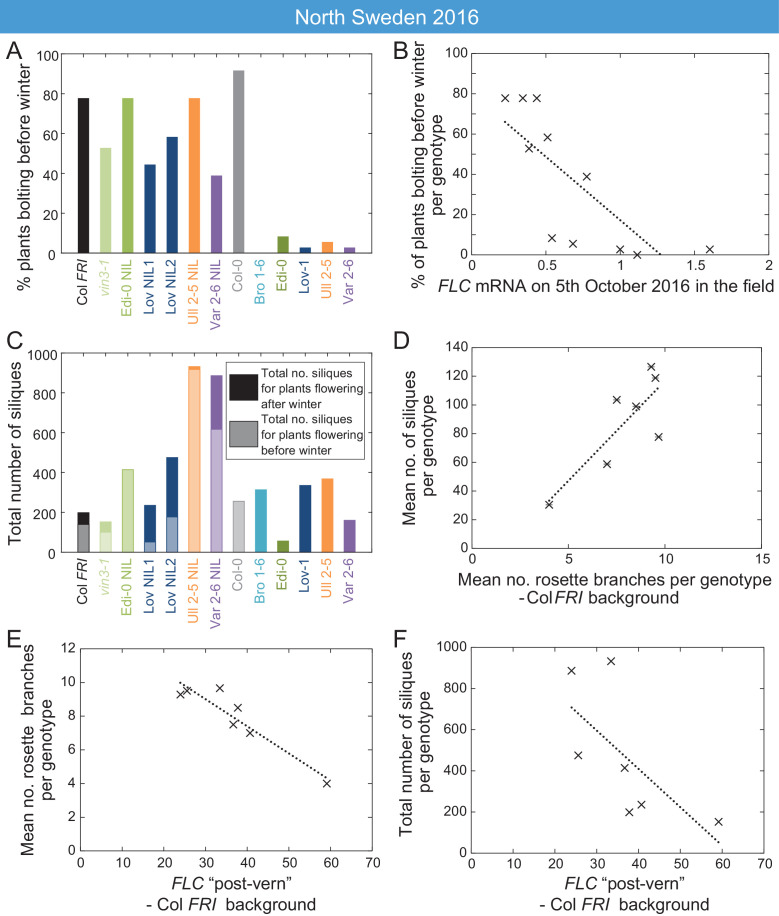
Figure 7. High FLC reduces precocious bolting in North Sweden in warm years.

(A) Percentage of plants bolting before winter in the North Sweden 2016 experiment by genotype. Plants in the field were less likely to flower precociously before winter (18th November 2016) if they are accessions from more northerly latitudes or, to a lesser degree, if they are FLC introgression lines containing FLC haplotypes from SV accessions. (B) The percentage of plants transitioning to flowering before winter per genotype negatively correlated with FLC expression (normalised to control) on 5th October (R2 = 0.59, p=0.0058). (C) Total number of siliques produced per genotype, showing contribution from plants that bolted before winter and plants that bolted after. Within the Col FRI genetic background there was no overall penalty in average silique number for surviving plants bolting before vs. after winter (92 and 77 per plant respectively, not significant in Mann-Whitney U test). (D) Mean silique production in plants surviving to set seed positively correlated to their mean rosette branch production for Col FRI genetic background genotypes (NILs and vin3-4; R2 = 0.56, p-value=0.002). (E) Rosette branch production of Col FRI genotypes surviving to set seed is strongly negatively correlated with the FLC post-vern value for that genotype as from Table 1 (R2 = 0.86, p-value<0.002). (F) Total number of siliques produced by Col FRI background genotypes plotted against FLC post-vern, linear regression for post-vern effect alone, R2 = 0.35, p-value=0.1. N = 36 plants sown (A–C), n for surviving plants (D–F) varies per genotype, see Source data 6.

Figure 7.

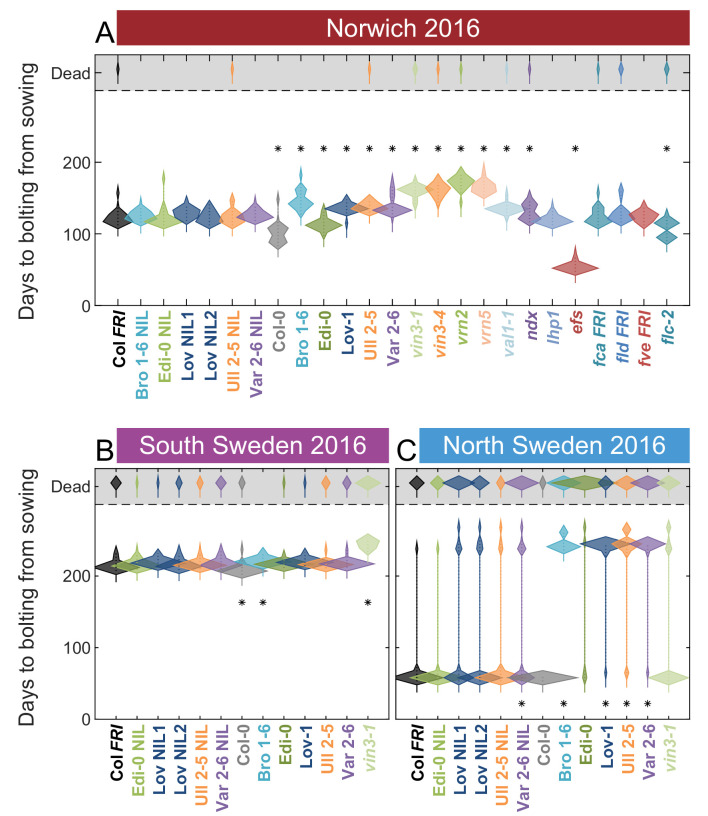
Figure 7—figure supplement 1. Flowering in the field across all sites in 2016–2017.

Figure 7—figure supplement 1.

Time to bolting for each genotype in (A) Norwich, (B) South Sweden and (C) North Sweden in 2016–7. Plots show the histogram of numbers of plants as the width of violin plots. A line connects the measurements to indicate the range. N = 24 for Norwich, N = 32 for South Sweden, N = 36 for North Sweden, Source data 6. For Norwich 2016–7, nearby building works resulted in increased light pollution at night, possibly causing earlier flowering.
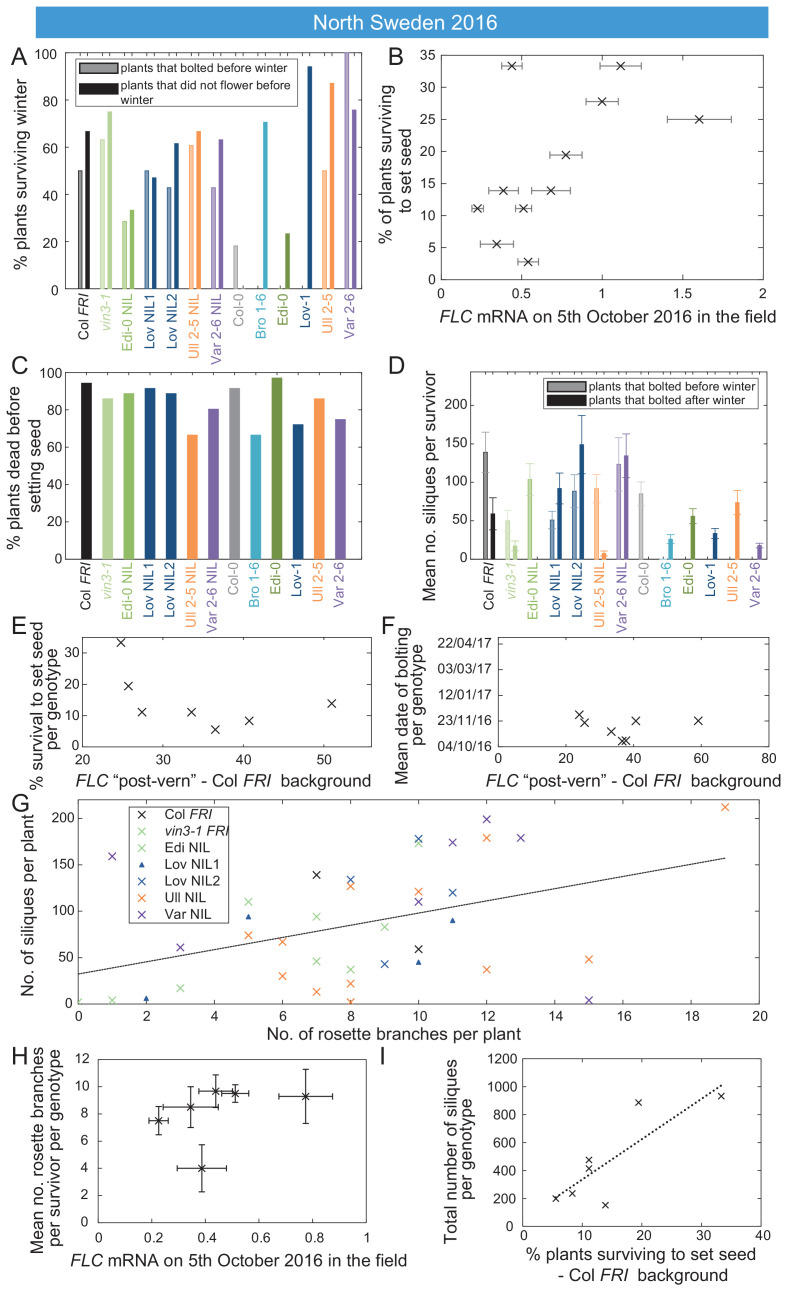
Figure 7—figure supplement 2. FLC affects fitness in North Sweden through bolting time and branching.

Figure 7—figure supplement 2.

Survival, branching and silique set in North Sweden are all correlated to aspects of FLC regulation. (A) Survival over winter of plants that bolted before winter in different genotypes vs. survival of plants that did not bolt before winter. (B) Survival to seed set plotted against FLC levels (normalised to control sample for 2016–7) in the field in North Sweden 2016 (p<0.003, Generalised Linear Models (GLMs) for binomial data). (C) Percentage mortality before setting seed was high for all genotypes. (D) Mean number of siliques for plants surviving to set seed that bolted before or after winter. (E) Survival in the field does not correlate with FLC post-vern for the Col FRI background (GLM with binomial distribution, p-value>0.1). (F) Date of bolting in the field does not correlate with FLC post-vern for the Col FRI background (linear regression, p-value>0.1). (G) Silique production by surviving Col FRI background plants correlates with number of rosette branches, though more weakly at the individual level than at the genotype average level (linear regression, R2 = 0.23, p-value=0.004). (H) Rosette branching of surviving Col FRI background plants does not correlate with FLC mRNA as measured on 5th October in the field (linear regression, p-value>0.1). (I) Total number of siliques produced by Col FRI background genotypes plotted against percentage survival of that genotype to point of seed set, linear regression for survival effect alone, R2 = 0.64, p-value=0.019. N = 36 plants sown (A, B, C, E, I) subsequent data based on survivors to seed set (D, G, H) and plants that survive to bolting (F), see Source data 6. Error bars are s.e.m.