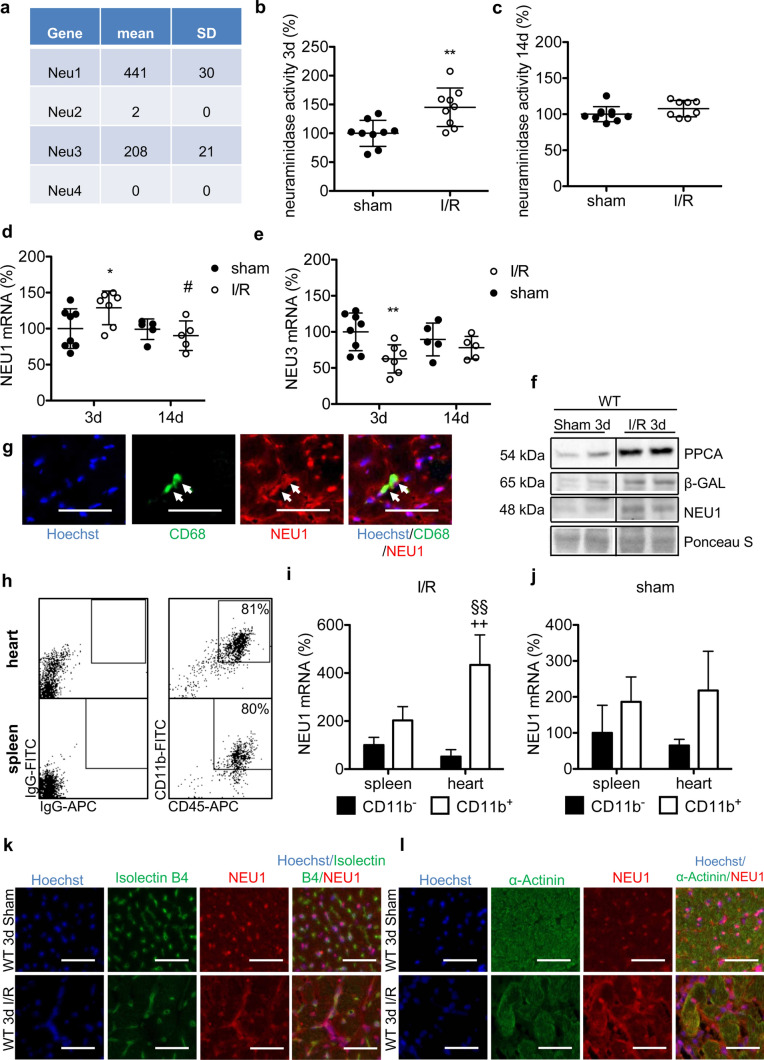
Fig. 1.
Induced NEU1 expression and activity in the LV after I/R. a Expression of NEU1-4 was analysed by RNAseq in RNA isolated from LV tissue from 3 pools (N = 3–4 per pool) of WT male mice, aged 3 months. Relative neuraminidase activity in ischemic LV of 129S2/SvPasCrl mice b 3 days and c 14 days after I/R, respectively, in comparison with sham-operated controls after normalization to protein content. Sham 3 days N = 9; I/R 3 days N = 9; sham 14 days N = 10; I/R 14 days N = 8. Relative NEU1 (d) and NEU3 (e) mRNA expression in ischemic LV of 129S2/SvPasCrl mice 3 days and 14 days after I/R, respectively, as compared with sham-operated controls after normalization to TPT1. Sham 3 days N = 8; I/R 3 days N = 7; sham 14 days N = 5; I/R 14 days N = 5. f Western blot analysis of NEU1 cofactors PPCA and β-GAL 3 days after I/R compared with sham WT LV. N = 2. g Representative immunostaining of NEU1 (red), CD68 (green) and nuclear Hoechst (blue) staining in WT LV 3 days after I/R. Scale bar: 50 µm. h Representative dot plots of flow cytometric analysis of isolated CD45hiCD11bhi cells from 129S2/SvPasCrl hearts 3 days after I/R. Relative NEU1 mRNA expression in CD11b+ and CD11b− cells, respectively, isolated from spleens or hearts of 129S2/SvPasCrl mice 3 days after I/R (i) or sham (j) operation, normalized to 18S. Data in h–j derive from 3 (sham) and 4 (I/R) independent experiments with 4–9 pooled hearts and spleens for each experiment. Representative immunostaining of NEU1 (red) upregulation in the heart 3 days after I/R in different cell types including epithelial cells (Isolectin B4 green) (k) and cardiomyocytes (α-actinin green) (l). Scale bar: 50 µm. All values are depicted as mean ± SD. Statistical analysis was done using Two-Way-ANOVA with Bonferroni post-test (d, e, i, j) and unpaired, two-tailed t test (b, c), respectively. *P < 0.05 and **P < 0.01 vs. sham; #P < 0.05 vs. 3 days; §§P < 0.01 vs. spleen; + +P < 0.01 vs. CD11b−

