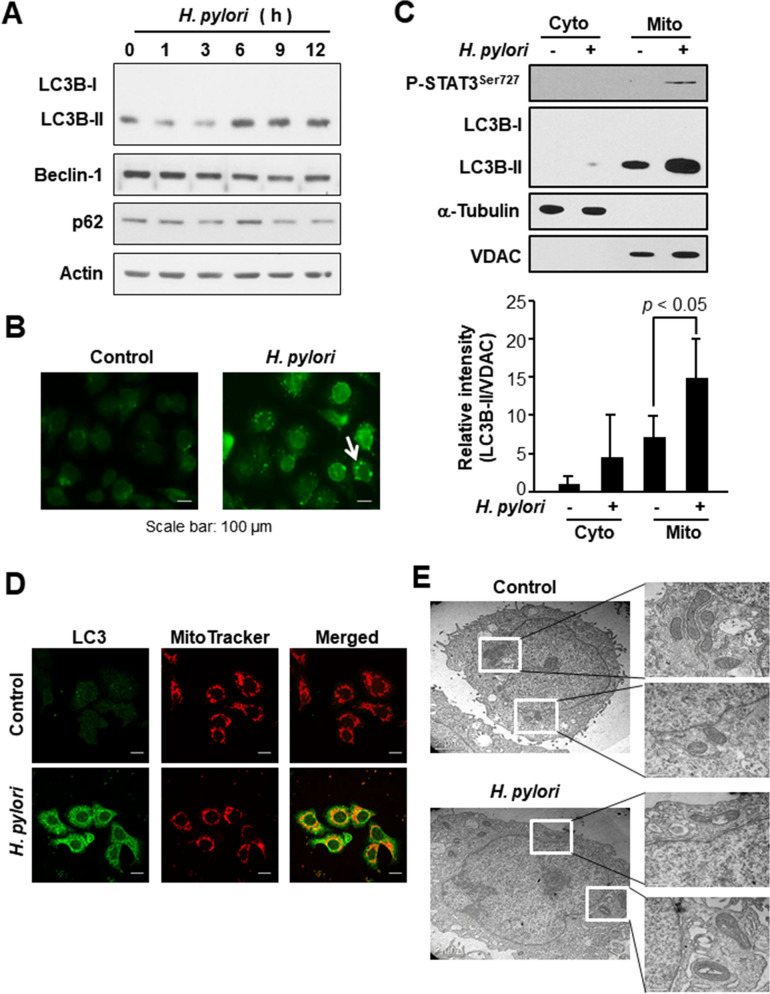
Figure 3.
Mitochondrial accumulation of an autophagy marker in H. pylori infected AGS cells. (A) AGS cells were infected with H. pylori and harvested at indicated time points. Western blot analyses of LC3B, Beclin 1, p62 and actin in whole cell lysates. (B) Immunocytochemical analysis of LC3 in AGS cells infected by H. pylori for 12 h. The arrow indicates the LC3 dots. (C) Western blot analysis of P-STAT3Ser727 and LC3B in cytosolic and mitochondrial fractions of H. pylori infected AGS cells. VDAC and α-tubulin were used as mitochondrial and cytoplasmic protein markers, respectively. The relative expression levels of LC3B-II from three independent experiments are presented means ± S.D. (D) Immunocytochemical analysis of LC3 in AGS cells co-cultured with H. pylori for 12 h. MitoTracker is a selective probe of mitochondria. Scale bar, 100 μm. (E) Transmission electron microscopy image of control cells and H. pylori-infected cells.

