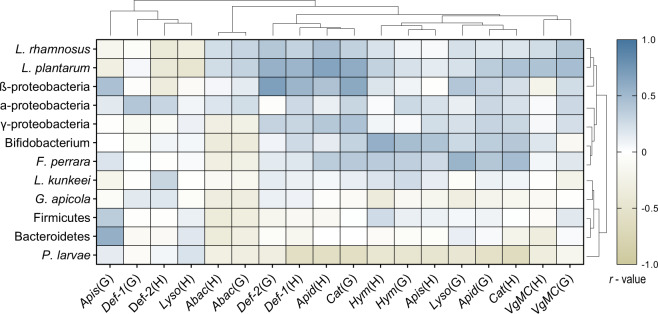
Fig. 6. Correlations between host gene expression and bacterial loads.
At the end of the 6-week experimental period, bacterial abundances in the guts of adult honey bees were compared with head and gut expression of nine immune- or antioxidant-related genes. Scale shown represents Pearson correlation coefficient, r, for n = 20–24 individual adults for each comparison. (G) = Gut gene expression, (H) = Head gene expression. The horizontal dendrogram acts to group host genes that covary in their expression patterns while the vertical dendrogram groups bacteria based on their co-occurring abundance relative to host gene expression. Both dendrograms were calculated using Euclidean distance and the complete ‘hclust’ function in R.

