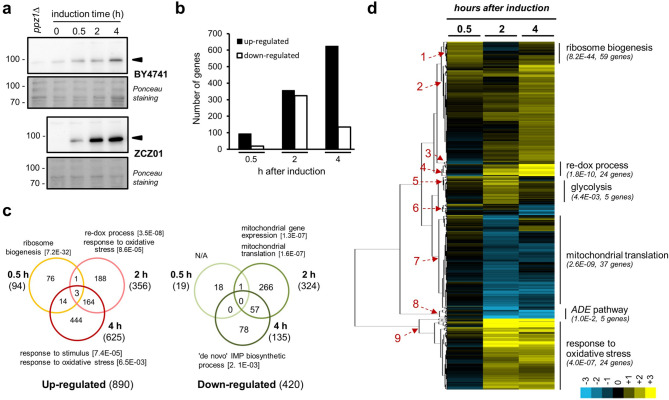
Figure 1.
Changes in transcriptomic profile upon overexpression of PPZ1. (a) Wild-type BY4741 and its isogenic derivative ZCZ01 (GAL1-10:PPZ1) cells were grown on YP with 2% raffinose (YP-Raff) until OD600 = 0.5 and then 2% galactose was added. Samples were taken at the indicated times, electrophoresed (40 μg of protein) and immunoblotted using polyclonal anti-Ppz1 antibodies. Extract from a ppz1Δ deletant is included as negative control. Arrowheads denote Ppz1 signal. Ponceau staining is shown for loading and transfer reference. All samples were loaded in the same gel and are shown separated for illustrative purposes. (b) Time-course distribution of up- and down-regulated genes. (c) Venn diagrams showing the number of genes whose expression was induced or repressed (≥ twofold, p < 0.05) at different times upon overexpression of PPZ1. Total numbers of genes in each category are in parentheses. Gene Ontology annotations, generated by YeastMine at SGD (https://yeastmine.yeastgenome.org/) with default settings, are also shown (p-values are in brackets). (d) Expression changes for 1,294 genes showing induction or repression at least at one time-point (mean values) were subjected to hierarchic clustering (Euclidean distance/complete linkage) using the Gene Cluster software v. 3.027. The result was visualized with Java Tree View v. 1.14528. Nine major cluster were obtained and the specific GO enrichment for several of them, including p-value and number of genes belonging to the specific category, is shown in parentheses. The intensity of the expression change can be inferred by comparison with the enclosed scale (log(2) values).

